3 各 Yocto 跟踪工具的基本用法与示例
本章介绍各跟踪工具的基本使用示例。
3.1 perf
perf 是随 Linux 内核提供的性能分析与跟踪工具。
虽然属于内核项目,它并不只用于分析和跟踪内核。 既可以只分析内核,也可以单独分析特定应用,选择是否包含内核上下文; 还可以同时跟踪内核和系统中的所有应用,获得系统全局视图。
在许多方面,perf 的目标是覆盖 Linux 现有全部跟踪与性能分析工具的功能, 包括本指南介绍的其他工具。过去几年,perf 已吸收了其中许多功能; 一些工具也移除了原有的大量实现,改为调用 perf 子系统的对应功能。 沿着这一趋势,其他工具将来可能完全失去独立存在的必要。 在此之前,本指南仍会介绍它们,并在合适的地方比较 perf 与其他工具如何完成相同任务。
下面介绍最常见的使用方式。完整文档可通过工具自身查看,或参见 perf(1)。
3 配置 perf
本节假设已经完成 基本配置 所述的基本配置。
尤其是,在 configuration file 中加入以下内容构建镜像, 可以更充分地发挥 perf 的作用::
INHIBIT_PACKAGE_STRIP = "1"
perf 大多运行在目标系统上。可以归档分析数据并复制到主机进行分析, 但下文假设你通过 SSH 连接,并在目标上执行 perf 命令。
3 perf 基本用法
perf 自身提供了较完整的帮助。直接输入 perf,即可查看基本用法及可用子命令::
root@crownbay:~# perf

usage: perf [--version] [--help] COMMAND [ARGS]

The most commonly used perf commands are:
  annotate        Read perf.data (created by perf record) and display annotated code
  archive         Create archive with object files with build-ids found in perf.data file
  bench           General framework for benchmark suites
  buildid-cache   Manage build-id cache.
  buildid-list    List the buildids in a perf.data file
  diff            Read two perf.data files and display the differential profile
  evlist          List the event names in a perf.data file
  inject          Filter to augment the events stream with additional information
  kmem            Tool to trace/measure kernel memory(slab) properties
  kvm             Tool to trace/measure kvm guest os
  list            List all symbolic event types
  lock            Analyze lock events
  probe           Define new dynamic tracepoints
  record          Run a command and record its profile into perf.data
  report          Read perf.data (created by perf record) and display the profile
  sched           Tool to trace/measure scheduler properties (latencies)
  script          Read perf.data (created by perf record) and display trace output
  stat            Run a command and gather performance counter statistics
  test            Runs sanity tests.
  timechart       Tool to visualize total system behavior during a workload
  top             System profiling tool.

See 'perf help COMMAND' for more information on a specific command.
3 使用 perf 进行基本性能分析
我们以 wget 下载一个较大的文件为简单测试。
它同时涉及文件和网络 I/O,具有一定分析价值。
至少在标准 Yocto 镜像中,wget 由 BusyBox 实现,
因此这里的方法也适用于 Yocto 支持的其他许多 BusyBox 小程序::
root@crownbay:~# rm linux-2.6.19.2.tar.bz2; \
                 wget https://downloads.yoctoproject.org/mirror/sources/linux-2.6.19.2.tar.bz2
要快速了解某项负载的总体情况,最简单的方式是 perf stat。
它使用几个默认计数器,在运行结束后显示累计值::
root@crownbay:~# perf stat wget https://downloads.yoctoproject.org/mirror/sources/linux-2.6.19.2.tar.bz2
Connecting to downloads.yoctoproject.org (140.211.169.59:80)
linux-2.6.19.2.tar.b 100% |***************************************************| 41727k  0:00:00 ETA

Performance counter stats for 'wget https://downloads.yoctoproject.org/mirror/sources/linux-2.6.19.2.tar.bz2':

      4597.223902 task-clock                #    0.077 CPUs utilized
            23568 context-switches          #    0.005 M/sec
               68 CPU-migrations            #    0.015 K/sec
              241 page-faults               #    0.052 K/sec
       3045817293 cycles                    #    0.663 GHz
  <not supported> stalled-cycles-frontend
  <not supported> stalled-cycles-backend
        858909167 instructions              #    0.28  insns per cycle
        165441165 branches                  #   35.987 M/sec
         19550329 branch-misses             #   11.82% of all branches

     59.836627620 seconds time elapsed
这么简单的测试并不总能揭示问题,但有时确实有用,参见 denzil live 镜像写入缓慢 的缺陷报告。
perf stat 并不限于固定计数器,基本上 perf list 列出的事件都可统计。
例如,可以汇总内核内存分配和释放相关事件,以及缓存命中和未命中::
root@crownbay:~# perf stat -e kmem:* -e cache-references -e cache-misses wget https://downloads.yoctoproject.org/mirror/sources/linux-2.6.19.2.tar.bz2
Connecting to downloads.yoctoproject.org (140.211.169.59:80)
linux-2.6.19.2.tar.b 100% |***************************************************| 41727k  0:00:00 ETA

Performance counter stats for 'wget https://downloads.yoctoproject.org/mirror/sources/linux-2.6.19.2.tar.bz2':

             5566 kmem:kmalloc
           125517 kmem:kmem_cache_alloc
                0 kmem:kmalloc_node
                0 kmem:kmem_cache_alloc_node
            34401 kmem:kfree
            69920 kmem:kmem_cache_free
              133 kmem:mm_page_free
               41 kmem:mm_page_free_batched
            11502 kmem:mm_page_alloc
            11375 kmem:mm_page_alloc_zone_locked
                0 kmem:mm_page_pcpu_drain
                0 kmem:mm_page_alloc_extfrag
         66848602 cache-references
          2917740 cache-misses              #    4.365 % of all cache refs

     44.831023415 seconds time elapsed
perf stat 便于快速了解一组事件的概况,但为了理解问题并采取有效措施,
通常还需要更详细的数据。
下一步可以使用 perf record 和 perf report 收集分析数据,
并通过交互式文本界面查看;向 perf report 传入 --stdio 则只输出文本。
先运行 perf record,将待分析的负载作为参数。
perf record 及其选项之后的内容会在新的 shell 中执行,本例没有额外选项。
perf 持续采样直到进程退出,并将结果写入当前目录的 perf.data::
root@crownbay:~# perf record wget https://downloads.yoctoproject.org/mirror/sources/linux-2.6.19.2.tar.bz2

Connecting to downloads.yoctoproject.org (140.211.169.59:80)
linux-2.6.19.2.tar.b 100% |************************************************| 41727k  0:00:00 ETA
[ perf record: Woken up 1 times to write data ]
[ perf record: Captured and wrote 0.176 MB perf.data (~7700 samples) ]
运行 perf report,即可读取当前目录中的 perf.data,
在交互式文本界面(TUI)中查看结果::
root@crownbay:~# perf report
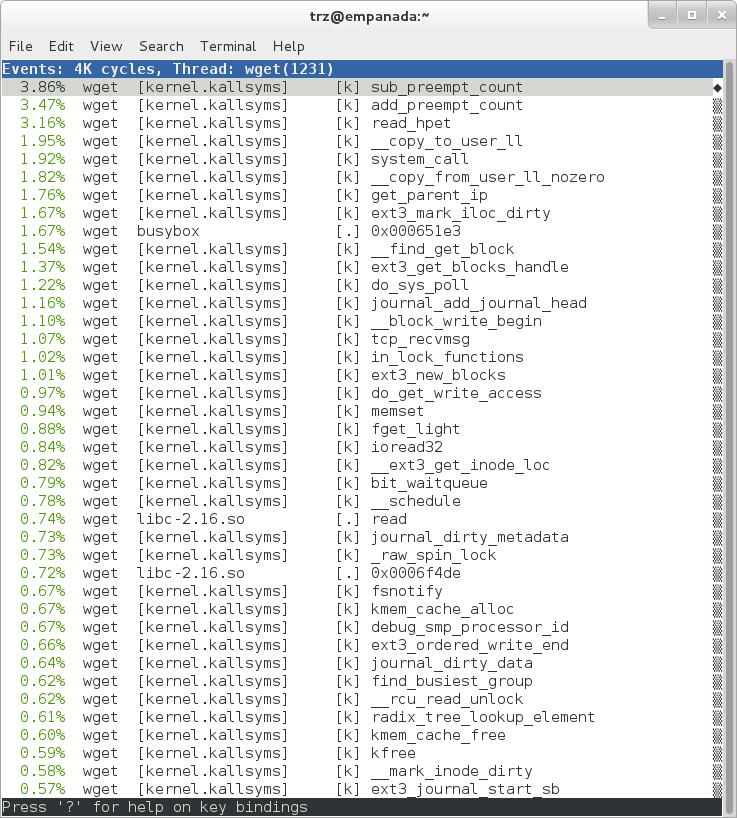
上图是平面分析视图,每个条目对应一个被采样函数,按采样占比从高到低排列。
perf 也支持其他排序键和顺序、只显示超过阈值的条目等,详见其文档。
图中既有用户空间函数(带 [.]),也有计入该进程的内核函数(带 [k])。
perf 的命令行选项可以限制只分析内核或用户空间等范围。
注意 busybox 条目,它是在 Yocto 中实现 wget 的可执行文件。
但这里没有显示有意义的函数名,而是十六进制数值。稍后会说明如何解决。
在此之前,先尝试稍有不同的分析:加入 -g,
不仅记录采样函数的地址,还记录通往该函数的完整调用链::
root@crownbay:~# perf record -g wget https://downloads.yoctoproject.org/mirror/sources/linux-2.6.19.2.tar.bz2
Connecting to downloads.yoctoproject.org (140.211.169.59:80)
linux-2.6.19.2.tar.b 100% |************************************************| 41727k  0:00:00 ETA
[ perf record: Woken up 3 times to write data ]
[ perf record: Captured and wrote 0.652 MB perf.data (~28476 samples) ]


root@crownbay:~# perf report
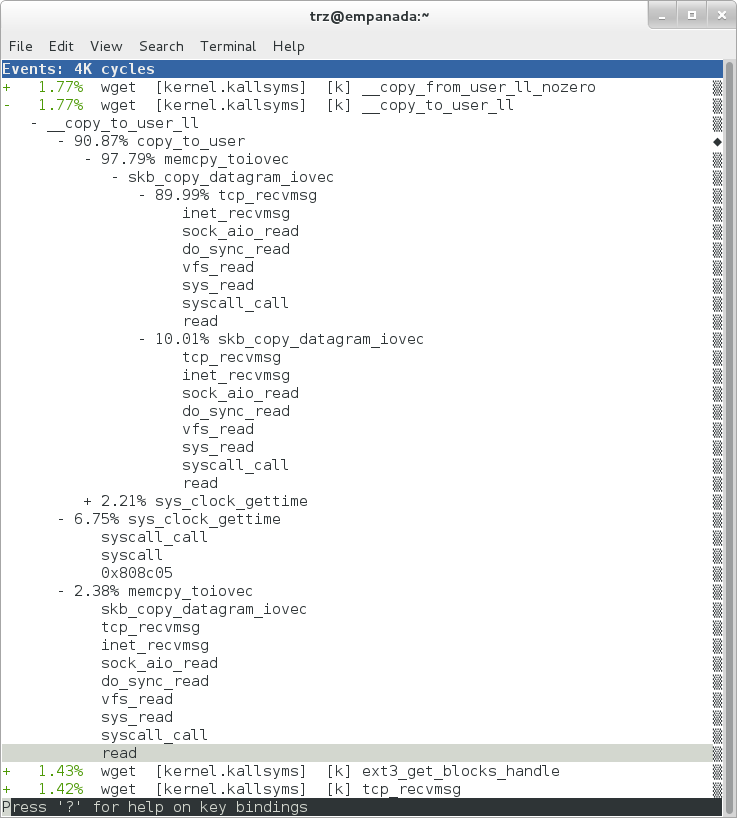
调用图不仅告诉我们哪些函数耗时最多,还展示这些函数如何被调用, 帮助理解程序与内核的交互。
上图每个条目左侧都有 +,表示可以展开查看调用链。
在条目上按 Enter 可展开;按 E 可全部展开,按 C 可全部折叠。
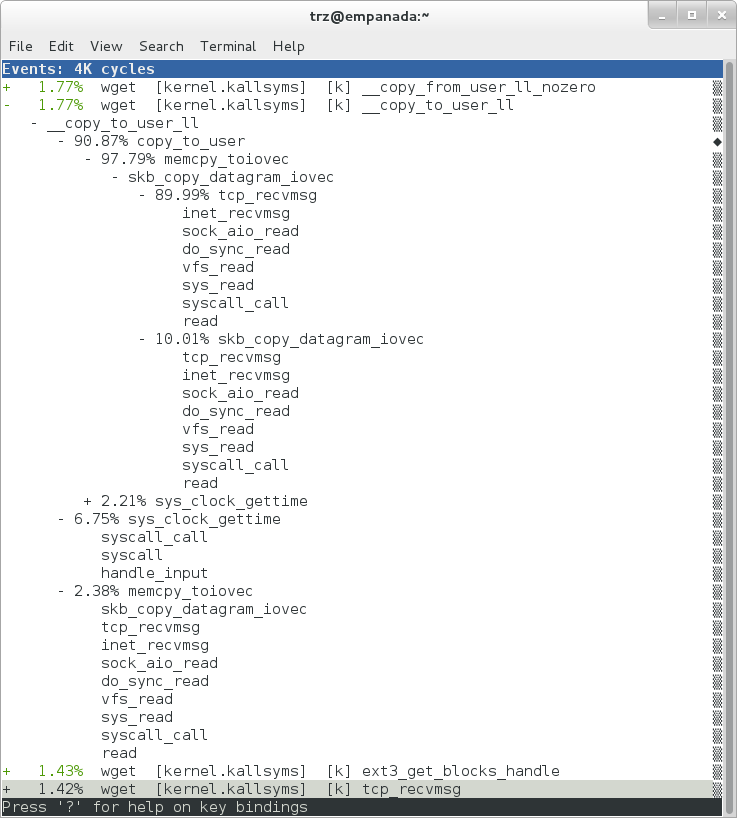
图中展开了 __copy_to_user_ll() 及多个子节点,
可以看到哪些调用链贡献了该函数的采样占比,它占总分析结果的 1.77%。
从整体上看,wget 从网络获取文件时,数据通过 socket 连接进入内核,
再交给用户空间的 wget (实际是 BusyBox 的一部分),
后者将内核提供的缓冲区写入磁盘文件。
上面的调用栈展示的是内核将 socket 中读到的数据交给 wget 的阶段,
也就是 copy-to-user。
展开的 sys_clock_gettime() 调用栈中也出现了十六进制值。
稍后会看到它被解析为 BusyBox 中的用户空间函数调用。
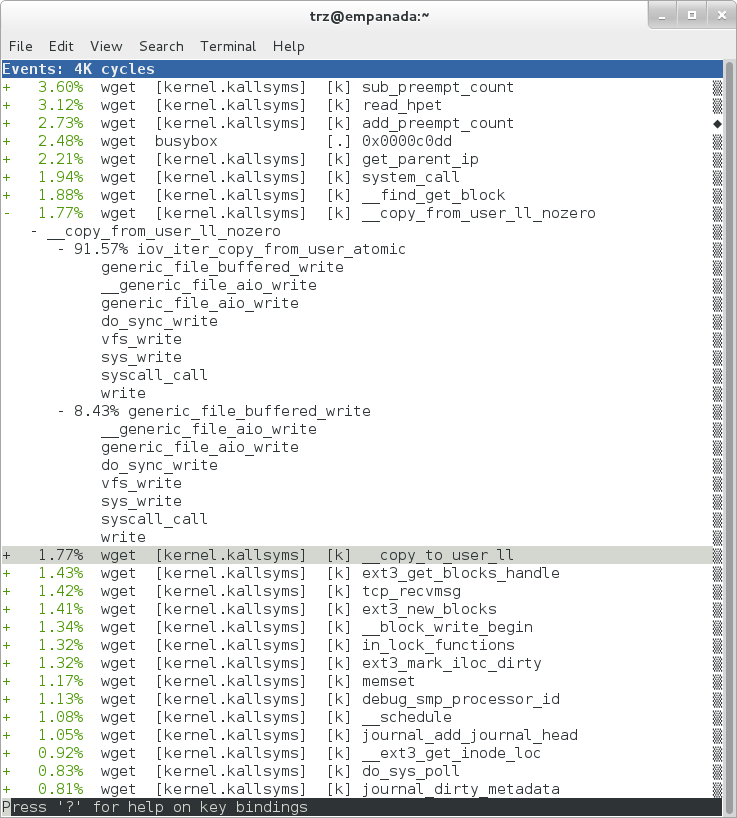
上图展示数据旅程的另一半:从 wget 的用户空间缓冲区写入磁盘。
wget 调用 write(2),将数据通过 copy-from-user 复制到内核,
内核再经过一系列路径(很可能也在分析数据中)将其写入磁盘。
了解数据布局和基本分析方法后,回到原来的目标:判断 wget 在哪里花费了时间。
由于 wget 实际上是 BusyBox 小程序,虽然进程名为 wget,
真正关注的可执行文件是 busybox。展开第一个包含 BusyBox 的条目:
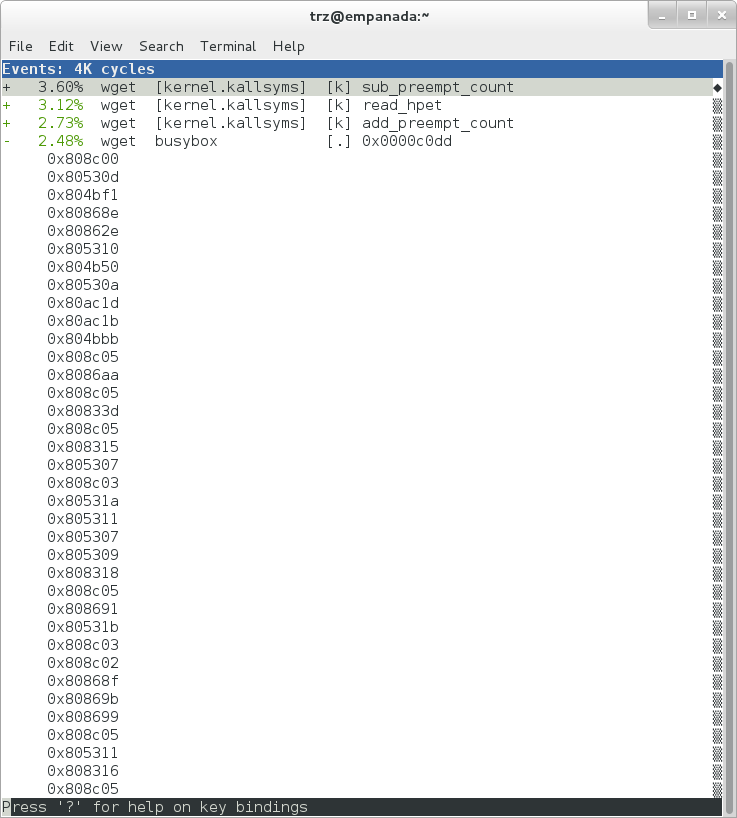
与大多数内核条目不同,它在展开前显示的是十六进制值,而非符号名。 展开后仍然如此。
原因是 perf 找不到 busybox 二进制文件的符号信息,
这些信息被 Yocto 构建系统剥离了。
一种处理方式是在构建镜像时,在 configuration file 中加入::
INHIBIT_PACKAGE_STRIP = "1"
但对于已经剥离符号的现有镜像,需要安装 BusyBox 的调试信息,才能让 perf 解析符号。
要为镜像中的软件包生成调试信息,可以在 build/conf/local.conf
的 EXTRA_IMAGE_FEATURES 中加入 dbg-pkgs,例如::
EXTRA_IMAGE_FEATURES:append = " dbg-pkgs"
另外,为生成 perf 能理解的调试信息类型,还需要在 configuration file 中设置 PACKAGE_DEBUG_SPLIT_STYLE::
PACKAGE_DEBUG_SPLIT_STYLE = 'debug-file-directory'
之后即可安装 BusyBox 调试信息。构建出的调试包位于主机的 build/tmp/deploy/rpm/*。
找到 busybox-dbg-...rpm 并复制到目标,例如::
[trz@empanada core2]$ scp /home/trz/yocto/crownbay-tracing-dbg/build/tmp/deploy/rpm/core2_32/busybox-dbg-1.20.2-r2.core2_32.rpm root@192.168.1.31:
busybox-dbg-1.20.2-r2.core2_32.rpm                     100% 1826KB   1.8MB/s   00:01
在目标上安装调试 RPM::
root@crownbay:~# rpm -i busybox-dbg-1.20.2-r2.core2_32.rpm
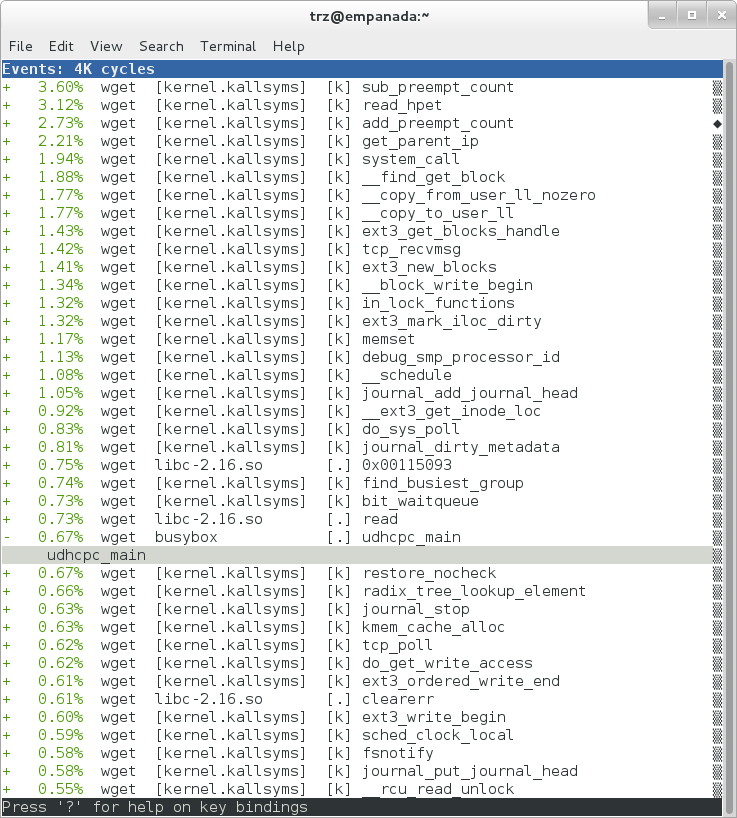
安装后,BusyBox 条目即可显示函数符号名:
展开某个条目,并在叶节点上按 Enter,会出现操作菜单,提供更多相关信息:
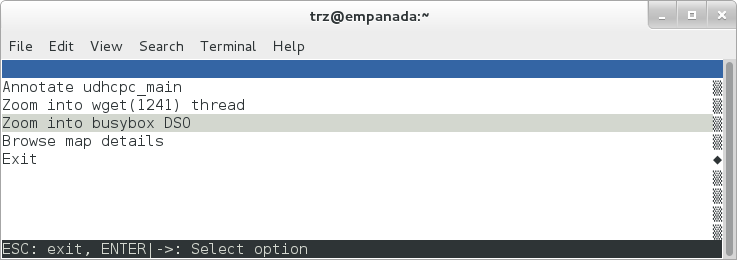
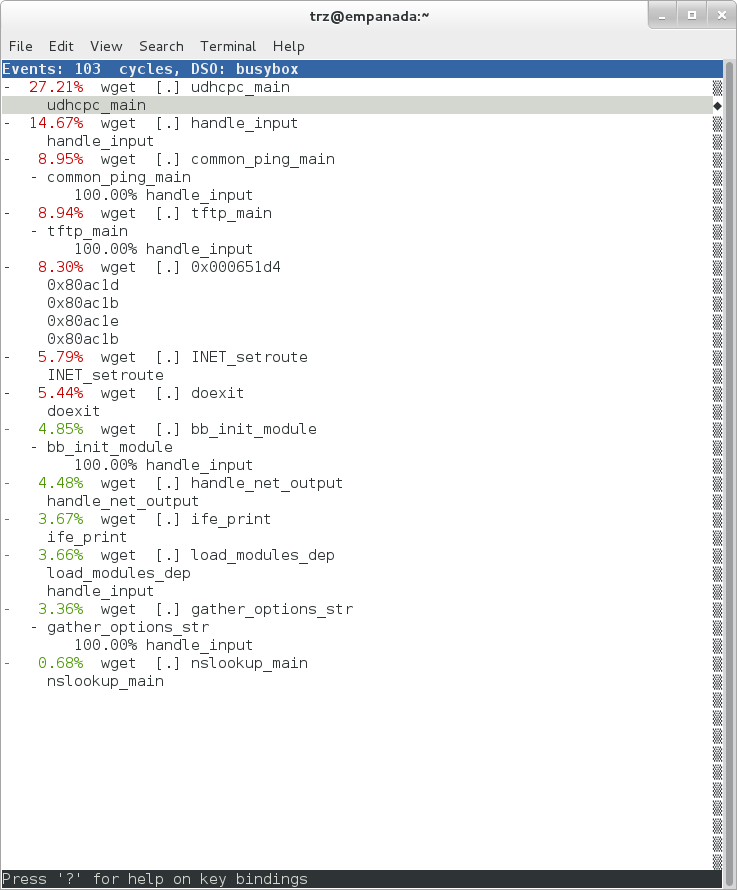
其中一个操作可以只显示与 busybox 相关的分析函数。
下图还使用 E 展开了全部节点:
安装 BusyBox 调试信息后,前面 sys_clock_gettime() 中无法解析的符号也能显示。
图中可见,贡献了 6.75% 的 copy-to-user 开销的 sys_clock_gettime 系统调用,
来自 BusyBox 的 handle_input() 函数:
进一步还可以深入到汇编级别,查看函数中哪些指令开销最大。
在 udhcpc_main 上按 Enter,再次打开菜单:
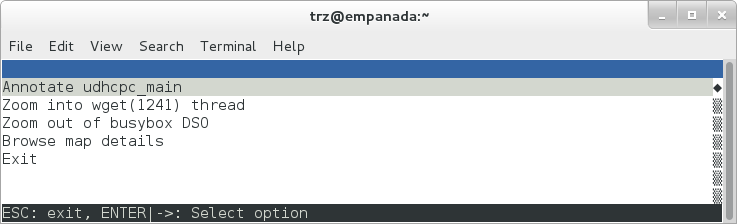
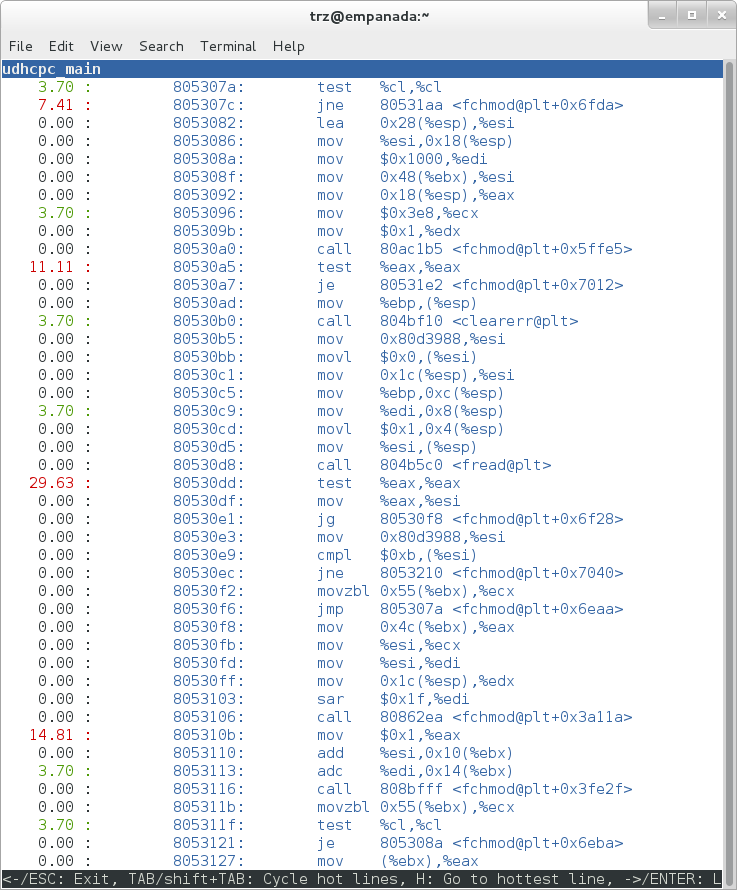
选择 Annotate udhcpc_main,即可查看各条指令的占比。
图中,该函数超过 50% 的时间用于几次测试以及将常量 1 移入寄存器:
作为转向跟踪的准备,再尝试使用默认 cycles 之外的计数器进行分析。
Linux 的跟踪与性能分析基础设施已经统一, 同一个工具可以使用完全不同的计数器集合,而不再局限于传统硬件计数器。 如前所述,传统工具也可以利用这些新能力,有些已经实现了支持。
通过 perf list 查看可用于分析负载的事件::
root@crownbay:~# perf list

List of pre-defined events (to be used in -e):
 cpu-cycles OR cycles                               [Hardware event]
 stalled-cycles-frontend OR idle-cycles-frontend    [Hardware event]
 stalled-cycles-backend OR idle-cycles-backend      [Hardware event]
 instructions                                       [Hardware event]
 cache-references                                   [Hardware event]
 cache-misses                                       [Hardware event]
 branch-instructions OR branches                    [Hardware event]
 branch-misses                                      [Hardware event]
 bus-cycles                                         [Hardware event]
 ref-cycles                                         [Hardware event]

 cpu-clock                                          [Software event]
 task-clock                                         [Software event]
 page-faults OR faults                              [Software event]
 minor-faults                                       [Software event]
 major-faults                                       [Software event]
 context-switches OR cs                             [Software event]
 cpu-migrations OR migrations                       [Software event]
 alignment-faults                                   [Software event]
 emulation-faults                                   [Software event]

 L1-dcache-loads                                    [Hardware cache event]
 L1-dcache-load-misses                              [Hardware cache event]
 L1-dcache-prefetch-misses                          [Hardware cache event]
 L1-icache-loads                                    [Hardware cache event]
 L1-icache-load-misses                              [Hardware cache event]
 .
 .
 .
 rNNN                                               [Raw hardware event descriptor]
 cpu/t1=v1[,t2=v2,t3 ...]/modifier                  [Raw hardware event descriptor]
  (see 'perf list --help' on how to encode it)

 mem:<addr>[:access]                                [Hardware breakpoint]

 sunrpc:rpc_call_status                             [Tracepoint event]
 sunrpc:rpc_bind_status                             [Tracepoint event]
 sunrpc:rpc_connect_status                          [Tracepoint event]
 sunrpc:rpc_task_begin                              [Tracepoint event]
 skb:kfree_skb                                      [Tracepoint event]
 skb:consume_skb                                    [Tracepoint event]
 skb:skb_copy_datagram_iovec                        [Tracepoint event]
 net:net_dev_xmit                                   [Tracepoint event]
 net:net_dev_queue                                  [Tracepoint event]
 net:netif_receive_skb                              [Tracepoint event]
 net:netif_rx                                       [Tracepoint event]
 napi:napi_poll                                     [Tracepoint event]
 sock:sock_rcvqueue_full                            [Tracepoint event]
 sock:sock_exceed_buf_limit                         [Tracepoint event]
 udp:udp_fail_queue_rcv_skb                         [Tracepoint event]
 hda:hda_send_cmd                                   [Tracepoint event]
 hda:hda_get_response                               [Tracepoint event]
 hda:hda_bus_reset                                  [Tracepoint event]
 scsi:scsi_dispatch_cmd_start                       [Tracepoint event]
 scsi:scsi_dispatch_cmd_error                       [Tracepoint event]
 scsi:scsi_eh_wakeup                                [Tracepoint event]
 drm:drm_vblank_event                               [Tracepoint event]
 drm:drm_vblank_event_queued                        [Tracepoint event]
 drm:drm_vblank_event_delivered                     [Tracepoint event]
 random:mix_pool_bytes                              [Tracepoint event]
 random:mix_pool_bytes_nolock                       [Tracepoint event]
 random:credit_entropy_bits                         [Tracepoint event]
 gpio:gpio_direction                                [Tracepoint event]
 gpio:gpio_value                                    [Tracepoint event]
 block:block_rq_abort                               [Tracepoint event]
 block:block_rq_requeue                             [Tracepoint event]
 block:block_rq_issue                               [Tracepoint event]
 block:block_bio_bounce                             [Tracepoint event]
 block:block_bio_complete                           [Tracepoint event]
 block:block_bio_backmerge                          [Tracepoint event]
 .
 .
 writeback:writeback_wake_thread                    [Tracepoint event]
 writeback:writeback_wake_forker_thread             [Tracepoint event]
 writeback:writeback_bdi_register                   [Tracepoint event]
 .
 .
 writeback:writeback_single_inode_requeue           [Tracepoint event]
 writeback:writeback_single_inode                   [Tracepoint event]
 kmem:kmalloc                                       [Tracepoint event]
 kmem:kmem_cache_alloc                              [Tracepoint event]
 kmem:mm_page_alloc                                 [Tracepoint event]
 kmem:mm_page_alloc_zone_locked                     [Tracepoint event]
 kmem:mm_page_pcpu_drain                            [Tracepoint event]
 kmem:mm_page_alloc_extfrag                         [Tracepoint event]
 vmscan:mm_vmscan_kswapd_sleep                      [Tracepoint event]
 vmscan:mm_vmscan_kswapd_wake                       [Tracepoint event]
 vmscan:mm_vmscan_wakeup_kswapd                     [Tracepoint event]
 vmscan:mm_vmscan_direct_reclaim_begin              [Tracepoint event]
 .
 .
 module:module_get                                  [Tracepoint event]
 module:module_put                                  [Tracepoint event]
 module:module_request                              [Tracepoint event]
 sched:sched_kthread_stop                           [Tracepoint event]
 sched:sched_wakeup                                 [Tracepoint event]
 sched:sched_wakeup_new                             [Tracepoint event]
 sched:sched_process_fork                           [Tracepoint event]
 sched:sched_process_exec                           [Tracepoint event]
 sched:sched_stat_runtime                           [Tracepoint event]
 rcu:rcu_utilization                                [Tracepoint event]
 workqueue:workqueue_queue_work                     [Tracepoint event]
 workqueue:workqueue_execute_end                    [Tracepoint event]
 signal:signal_generate                             [Tracepoint event]
 signal:signal_deliver                              [Tracepoint event]
 timer:timer_init                                   [Tracepoint event]
 timer:timer_start                                  [Tracepoint event]
 timer:hrtimer_cancel                               [Tracepoint event]
 timer:itimer_state                                 [Tracepoint event]
 timer:itimer_expire                                [Tracepoint event]
 irq:irq_handler_entry                              [Tracepoint event]
 irq:irq_handler_exit                               [Tracepoint event]
 irq:softirq_entry                                  [Tracepoint event]
 irq:softirq_exit                                   [Tracepoint event]
 irq:softirq_raise                                  [Tracepoint event]
 printk:console                                     [Tracepoint event]
 task:task_newtask                                  [Tracepoint event]
 task:task_rename                                   [Tracepoint event]
 syscalls:sys_enter_socketcall                      [Tracepoint event]
 syscalls:sys_exit_socketcall                       [Tracepoint event]
 .
 .
 .
 syscalls:sys_enter_unshare                         [Tracepoint event]
 syscalls:sys_exit_unshare                          [Tracepoint event]
 raw_syscalls:sys_enter                             [Tracepoint event]
 raw_syscalls:sys_exit                              [Tracepoint event]
工具之间的联系
这正是 trace event 子系统定义的事件集合。ftrace、trace-cmd 和 KernelShark
将其呈现为 /sys/kernel/debug/tracing/events 中的文件;
SystemTap 使用 kernel.trace("tracepoint_name") 访问,LTTng 也能访问其中一部分。
分析当前负载时,只需关注其中一部分。
选择最相关的子系统(Tracepoint 事件中冒号前的字符串),
通过通配符运行 perf stat::
root@crownbay:~# perf stat -e skb:* -e net:* -e napi:* -e sched:* -e workqueue:* -e irq:* -e syscalls:* wget https://downloads.yoctoproject.org/mirror/sources/linux-2.6.19.2.tar.bz2
Performance counter stats for 'wget https://downloads.yoctoproject.org/mirror/sources/linux-2.6.19.2.tar.bz2':

            23323 skb:kfree_skb
                0 skb:consume_skb
            49897 skb:skb_copy_datagram_iovec
             6217 net:net_dev_xmit
             6217 net:net_dev_queue
             7962 net:netif_receive_skb
                2 net:netif_rx
             8340 napi:napi_poll
                0 sched:sched_kthread_stop
                0 sched:sched_kthread_stop_ret
             3749 sched:sched_wakeup
                0 sched:sched_wakeup_new
                0 sched:sched_switch
               29 sched:sched_migrate_task
                0 sched:sched_process_free
                1 sched:sched_process_exit
                0 sched:sched_wait_task
                0 sched:sched_process_wait
                0 sched:sched_process_fork
                1 sched:sched_process_exec
                0 sched:sched_stat_wait
    2106519415641 sched:sched_stat_sleep
                0 sched:sched_stat_iowait
        147453613 sched:sched_stat_blocked
      12903026955 sched:sched_stat_runtime
                0 sched:sched_pi_setprio
             3574 workqueue:workqueue_queue_work
             3574 workqueue:workqueue_activate_work
                0 workqueue:workqueue_execute_start
                0 workqueue:workqueue_execute_end
            16631 irq:irq_handler_entry
            16631 irq:irq_handler_exit
            28521 irq:softirq_entry
            28521 irq:softirq_exit
            28728 irq:softirq_raise
                1 syscalls:sys_enter_sendmmsg
                1 syscalls:sys_exit_sendmmsg
                0 syscalls:sys_enter_recvmmsg
                0 syscalls:sys_exit_recvmmsg
               14 syscalls:sys_enter_socketcall
               14 syscalls:sys_exit_socketcall
                  .
                  .
                  .
            16965 syscalls:sys_enter_read
            16965 syscalls:sys_exit_read
            12854 syscalls:sys_enter_write
            12854 syscalls:sys_exit_write
                  .
                  .
                  .

     58.029710972 seconds time elapsed
选取一个跟踪点,让 perf 将其作为采样事件::
root@crownbay:~# perf record -g -e sched:sched_wakeup wget https://downloads.yoctoproject.org/mirror/sources/linux-2.6.19.2.tar.bz2
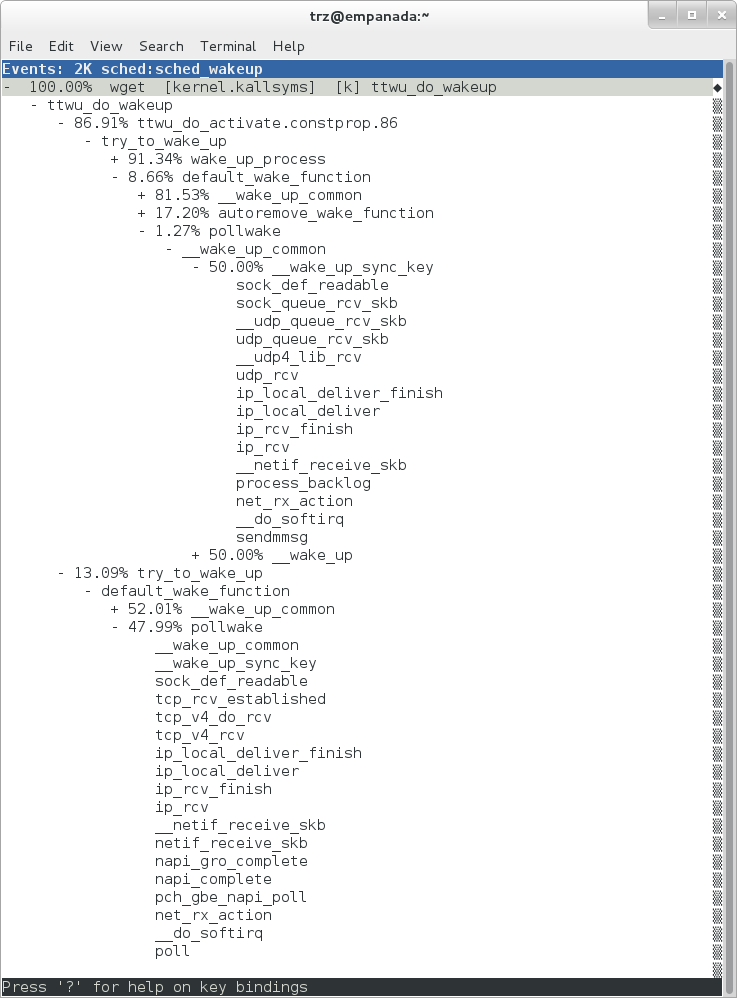
上图展示使用 sched:sched_switch 跟踪点进行分析的结果,
显示通向 sched_wakeup 的不同路径的相对开销。
注意,sched_wakeup 是跟踪点名称,它实际定义在 ttwu_do_wakeup() 内,
因此分析视图中显示后者的函数名:
/*
 * Mark the task runnable and perform wakeup-preemption.
 */
static void
ttwu_do_wakeup(struct rq *rq, struct task_struct *p, int wake_flags)
{
     trace_sched_wakeup(p, true);
     .
     .
     .
}
图中展开了几条较有意思的调用链,基本上都是网络接收路径, 很可能在网络数据准备好后唤醒 wget(BusyBox)。
由于跟踪点通常用于跟踪,其默认采样周期为 1,即每次事件发生都采样,
可以通过 -c 修改。相比之下,常规分析使用的 cycles 等硬件计数器
通常采用数千次事件的采样间隔:性能分析应尽量降低开销,
而每个周期都采样的成本太高。
3 使用 perf 进行基本跟踪
性能分析适合解决许多问题,也能提供负载或整个系统的高层视图。
但它依赖 sampling,即采样,本质上是一种近似。
采样以较低成本提供有代表性的系统状态,但如果还需要深入确定实际发生了什么,
仅凭这些数据就会受到限制。
此时需要查看,或以更合适的方式汇总,构成粗粒度高层行为的每个具体步骤。
例如,可以跟踪所有可能与负载相关的事件::
root@crownbay:~# perf record -g -e skb:* -e net:* -e napi:* -e sched:sched_switch -e sched:sched_wakeup -e irq:*
 -e syscalls:sys_enter_read -e syscalls:sys_exit_read -e syscalls:sys_enter_write -e syscalls:sys_exit_write
 wget https://downloads.yoctoproject.org/mirror/sources/linux-2.6.19.2.tar.bz2
不带参数运行 perf script,查看原始跟踪输出::
root@crownbay:~# perf script

      perf  1262 [000] 11624.857082: sys_exit_read: 0x0
      perf  1262 [000] 11624.857193: sched_wakeup: comm=migration/0 pid=6 prio=0 success=1 target_cpu=000
      wget  1262 [001] 11624.858021: softirq_raise: vec=1 [action=TIMER]
      wget  1262 [001] 11624.858074: softirq_entry: vec=1 [action=TIMER]
      wget  1262 [001] 11624.858081: softirq_exit: vec=1 [action=TIMER]
      wget  1262 [001] 11624.858166: sys_enter_read: fd: 0x0003, buf: 0xbf82c940, count: 0x0200
      wget  1262 [001] 11624.858177: sys_exit_read: 0x200
      wget  1262 [001] 11624.858878: kfree_skb: skbaddr=0xeb248d80 protocol=0 location=0xc15a5308
      wget  1262 [001] 11624.858945: kfree_skb: skbaddr=0xeb248000 protocol=0 location=0xc15a5308
      wget  1262 [001] 11624.859020: softirq_raise: vec=1 [action=TIMER]
      wget  1262 [001] 11624.859076: softirq_entry: vec=1 [action=TIMER]
      wget  1262 [001] 11624.859083: softirq_exit: vec=1 [action=TIMER]
      wget  1262 [001] 11624.859167: sys_enter_read: fd: 0x0003, buf: 0xb7720000, count: 0x0400
      wget  1262 [001] 11624.859192: sys_exit_read: 0x1d7
      wget  1262 [001] 11624.859228: sys_enter_read: fd: 0x0003, buf: 0xb7720000, count: 0x0400
      wget  1262 [001] 11624.859233: sys_exit_read: 0x0
      wget  1262 [001] 11624.859573: sys_enter_read: fd: 0x0003, buf: 0xbf82c580, count: 0x0200
      wget  1262 [001] 11624.859584: sys_exit_read: 0x200
      wget  1262 [001] 11624.859864: sys_enter_read: fd: 0x0003, buf: 0xb7720000, count: 0x0400
      wget  1262 [001] 11624.859888: sys_exit_read: 0x400
      wget  1262 [001] 11624.859935: sys_enter_read: fd: 0x0003, buf: 0xb7720000, count: 0x0400
      wget  1262 [001] 11624.859944: sys_exit_read: 0x400
这样得到的是负载运行期间相关事件的详细序列,每项都带有时间戳。
从许多方面看,性能分析可以视为跟踪的子集。 理论上,只要跟踪事件足以覆盖负载的重要方面,就能推导出性能分析产生的各种结果和视图。
传统性能分析虽然功能强大,但受限于底层数据粒度。 工具可以通过不同排序和展示方式帮助用户探索数据, 却无法提取采样时没有保留下来的信息。
完整而详细的跟踪数据,则允许以非常多样的方式处理和展示收集到的信息。
仅靠“原始”计数器生成有意义输出的方式是有限的。
要获得比简单计数更复杂的信息,需要针对具体问题增加逻辑。
例如,进程被安排在处理器上运行到实际开始运行之间的时间差,
并不存在一个现成的硬件计数器,但可以推导出名为 wakeup_latency 的指标,
再从跟踪数据中获得有用视图。
类似地,标准性能分析工具无法直接告诉我们系统中每个进程读写了多少数据,
以及多少次读写完全失败。足够的跟踪数据配合合适工具则可以做到,
只是需要超出现成性能分析工具的能力。
这类需求可以通过编程语言解决。针对特定数据格式提供便于使用的编程接口, 就是该数据与语言的“语言绑定”。perf 支持 Python 和 Perl 两种语言绑定。
工具之间的联系
使用语言绑定处理和聚合跟踪数据并不是新想法。 早期项目之一是 IBM DProbes 的 dpcc 编译器:它是 ANSI C 编译器, 目标为运行在目标系统内核解释器上的低级汇编语言。 Sun 的 DTrace 采用类似方式,只是为此设计了自己的语言。 受 DTrace 启发的 SystemTap 也创造了专用语言,但不使用内核解释器, 而是通过较复杂的编译机制,将该语言转换为 C 编写的内核模块。
已有 perf.data 后,可以使用 perf script -g 生成脚本框架,
为记录的 read/write 进入与退出事件创建处理函数::
root@crownbay:~# perf script -g python
generated Python script: perf-script.py
脚本框架为 perf.data 中每种事件生成一个 Python 函数,
函数体仅打印事件名称和参数,例如:
def net__netif_rx(event_name, context, common_cpu,
       common_secs, common_nsecs, common_pid, common_comm,
       skbaddr, len, name):
               print_header(event_name, common_cpu, common_secs, common_nsecs,
                       common_pid, common_comm)

               print "skbaddr=%u, len=%u, name=%s\n" % (skbaddr, len, name),
直接运行该脚本,即可打印 perf.data 中的所有事件::
root@crownbay:~# perf script -s perf-script.py

in trace_begin
syscalls__sys_exit_read     0 11624.857082795     1262 perf                  nr=3, ret=0
sched__sched_wakeup      0 11624.857193498     1262 perf                  comm=migration/0, pid=6, prio=0,      success=1, target_cpu=0
irq__softirq_raise       1 11624.858021635     1262 wget                  vec=TIMER
irq__softirq_entry       1 11624.858074075     1262 wget                  vec=TIMER
irq__softirq_exit        1 11624.858081389     1262 wget                  vec=TIMER
syscalls__sys_enter_read     1 11624.858166434     1262 wget                  nr=3, fd=3, buf=3213019456,      count=512
syscalls__sys_exit_read     1 11624.858177924     1262 wget                  nr=3, ret=512
skb__kfree_skb           1 11624.858878188     1262 wget                  skbaddr=3945041280,           location=3243922184, protocol=0
skb__kfree_skb           1 11624.858945608     1262 wget                  skbaddr=3945037824,      location=3243922184, protocol=0
irq__softirq_raise       1 11624.859020942     1262 wget                  vec=TIMER
irq__softirq_entry       1 11624.859076935     1262 wget                  vec=TIMER
irq__softirq_exit        1 11624.859083469     1262 wget                  vec=TIMER
syscalls__sys_enter_read     1 11624.859167565     1262 wget                  nr=3, fd=3, buf=3077701632,      count=1024
syscalls__sys_exit_read     1 11624.859192533     1262 wget                  nr=3, ret=471
syscalls__sys_enter_read     1 11624.859228072     1262 wget                  nr=3, fd=3, buf=3077701632,      count=1024
syscalls__sys_exit_read     1 11624.859233707     1262 wget                  nr=3, ret=0
syscalls__sys_enter_read     1 11624.859573008     1262 wget                  nr=3, fd=3, buf=3213018496,      count=512
syscalls__sys_exit_read     1 11624.859584818     1262 wget                  nr=3, ret=512
syscalls__sys_enter_read     1 11624.859864562     1262 wget                  nr=3, fd=3, buf=3077701632,      count=1024
syscalls__sys_exit_read     1 11624.859888770     1262 wget                  nr=3, ret=1024
syscalls__sys_enter_read     1 11624.859935140     1262 wget                  nr=3, fd=3, buf=3077701632,      count=1024
syscalls__sys_exit_read     1 11624.859944032     1262 wget                  nr=3, ret=1024
这本身用途有限,因为在同一目录中直接运行无参数的 perf script,
也能得到基本相同的结果。
但可以任意替换生成函数中的打印语句,从而实现更有用的处理。
作为简单示例,将打印语句替换为按事件累加计数的函数。 脚本处理 perf.data 时,每遇到一次某事件,就增加该事件的计数,例如:
def net__netif_rx(event_name, context, common_cpu,
       common_secs, common_nsecs, common_pid, common_comm,
       skbaddr, len, name):
           inc_counts(event_name)
将各事件处理函数都改为这种方式。为方便起见,定义公共函数 inc_counts(),
由各处理函数调用。它通过 counts 哈希记录每种事件的数量。
这个特殊哈希具有类似 Perl 的自动创建嵌套项功能,
非常适合跟踪处理中常见的多层聚合。详见 perf 的 Python 绑定文档:
counts = autodict()

def inc_counts(event_name):
       try:
               counts[event_name] += 1
       except TypeError:
               counts[event_name] = 1
最后,通过特殊函数 trace_end() 在跟踪处理结束时打印各事件计数:
def trace_end():
       for event_name, count in counts.iteritems():
               print "%-40s %10s\n" % (event_name, count)
最终结果是跟踪中全部事件的汇总::
skb__skb_copy_datagram_iovec                  13148
irq__softirq_entry                             4796
irq__irq_handler_exit                          3805
irq__softirq_exit                              4795
syscalls__sys_enter_write                      8990
net__net_dev_xmit                               652
skb__kfree_skb                                 4047
sched__sched_wakeup                            1155
irq__irq_handler_entry                         3804
irq__softirq_raise                             4799
net__net_dev_queue                              652
syscalls__sys_enter_read                      17599
net__netif_receive_skb                         1743
syscalls__sys_exit_read                       17598
net__netif_rx                                     2
napi__napi_poll                                1877
syscalls__sys_exit_write                       8990
它与 perf stat 提供的信息几乎相同,
也印证了前面的观点:合适的跟踪数据可以推导出高层性能分析摘要。
使用说明见 perf script 的 Python 绑定。
3 全系统跟踪与性能分析
前面的示例都针对特定程序或负载,即在命令行明确指定待分析程序,
例如 perf record wget ...。
也可以在一个 shell 中运行全系统分析或跟踪,在另一个 shell 中单独运行负载。 许多情况下,这样更有价值。
全系统分析或跟踪通常使用 perf record 的 -a 选项。
先打开一个窗口,使用 -a 启动分析,按 Ctrl-C 停止::
root@crownbay:~# perf record -g -a
^C[ perf record: Woken up 6 times to write data ]
[ perf record: Captured and wrote 1.400 MB perf.data (~61172 samples) ]
在另一个窗口中运行 wget 测试::
root@crownbay:~# wget https://downloads.yoctoproject.org/mirror/sources/linux-2.6.19.2.tar.bz2
Connecting to downloads.yoctoproject.org (140.211.169.59:80)
linux-2.6.19.2.tar.b 100% \|*******************************\| 41727k 0:00:00 ETA
此时不仅能看到 wget 的条目,还能看到系统中其他进程:
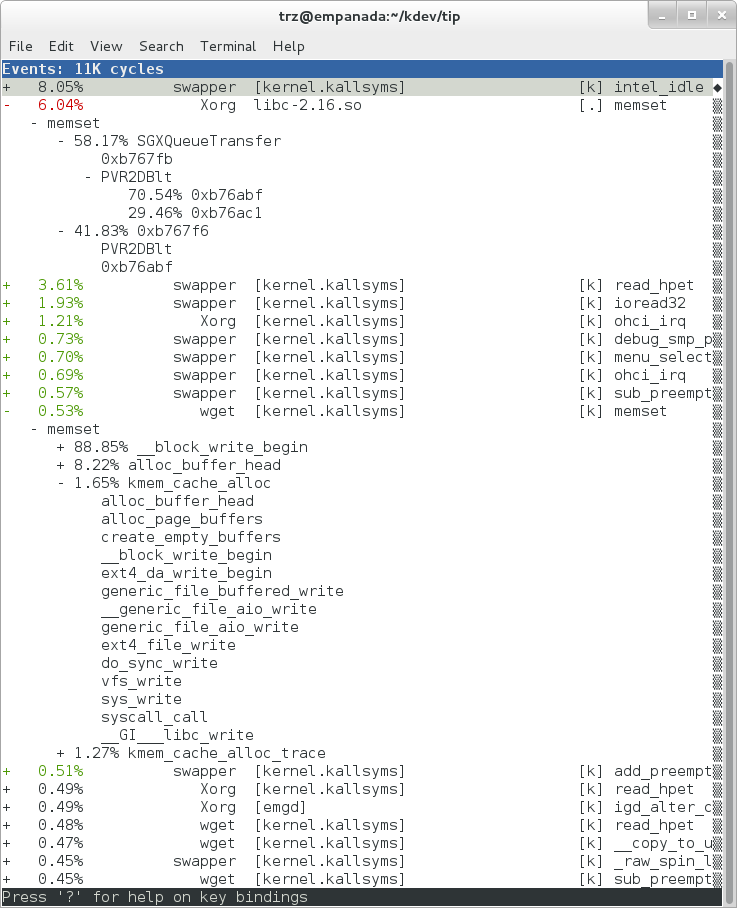
上图中有来自 libc 的调用链,也有来自 Xorg 的调用链。
展开 Xorg 后出现的 PVR 及其他无法解析的符号,表明用户空间使用了专有 X 驱动。
图中同时包含内核和用户空间条目。
记录时为 cycles 硬件计数器加上 u 修饰符,可以只关注用户空间::
root@crownbay:~# perf record -g -a -e cycles:u
^C[ perf record: Woken up 2 times to write data ]
[ perf record: Captured and wrote 0.376 MB perf.data (~16443 samples) ]
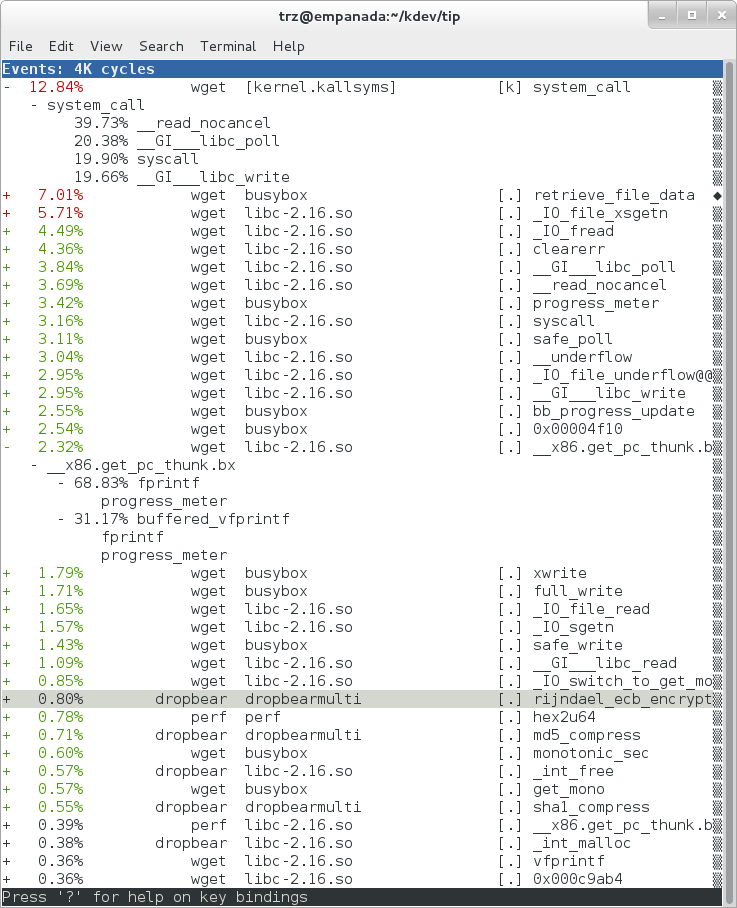
上图只显示用户空间条目([.])。
在叶节点上按 Enter,选择 Zoom into DSO,
还可以只显示某个动态共享对象(DSO)的条目。
下图聚焦于 libc,展示与 libc-xxx.so 相关的全部条目。
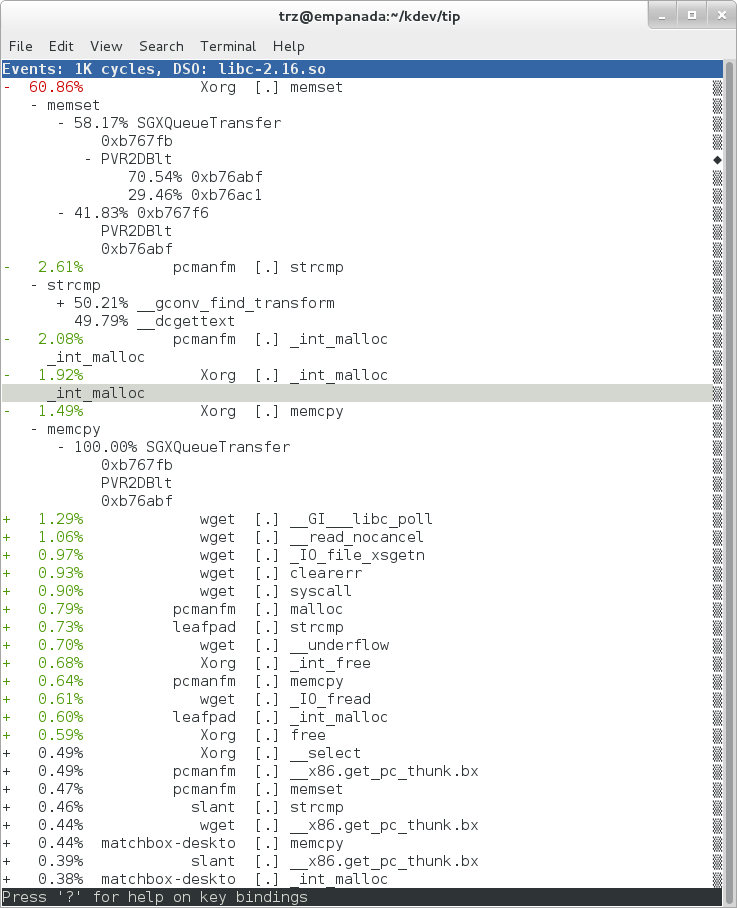
同样可以使用 -a 进行全系统跟踪。下面跟踪几个调度器事件::
root@crownbay:~# perf record -a -e sched:sched_switch -e sched:sched_wakeup
^C[ perf record: Woken up 38 times to write data ]
[ perf record: Captured and wrote 9.780 MB perf.data (~427299 samples) ]
运行无参数的 perf script 查看原始输出::
root@crownbay:~# perf script

           perf  1383 [001]  6171.460045: sched_wakeup: comm=kworker/1:1 pid=21 prio=120 success=1 target_cpu=001
           perf  1383 [001]  6171.460066: sched_switch: prev_comm=perf prev_pid=1383 prev_prio=120 prev_state=R+ ==> next_comm=kworker/1:1 next_pid=21 next_prio=120
    kworker/1:1    21 [001]  6171.460093: sched_switch: prev_comm=kworker/1:1 prev_pid=21 prev_prio=120 prev_state=S ==> next_comm=perf next_pid=1383 next_prio=120
        swapper     0 [000]  6171.468063: sched_wakeup: comm=kworker/0:3 pid=1209 prio=120 success=1 target_cpu=000
        swapper     0 [000]  6171.468107: sched_switch: prev_comm=swapper/0 prev_pid=0 prev_prio=120 prev_state=R ==> next_comm=kworker/0:3 next_pid=1209 next_prio=120
    kworker/0:3  1209 [000]  6171.468143: sched_switch: prev_comm=kworker/0:3 prev_pid=1209 prev_prio=120 prev_state=S ==> next_comm=swapper/0 next_pid=0 next_prio=120
           perf  1383 [001]  6171.470039: sched_wakeup: comm=kworker/1:1 pid=21 prio=120 success=1 target_cpu=001
           perf  1383 [001]  6171.470058: sched_switch: prev_comm=perf prev_pid=1383 prev_prio=120 prev_state=R+ ==> next_comm=kworker/1:1 next_pid=21 next_prio=120
    kworker/1:1    21 [001]  6171.470082: sched_switch: prev_comm=kworker/1:1 prev_pid=21 prev_prio=120 prev_state=S ==> next_comm=perf next_pid=1383 next_prio=120
           perf  1383 [001]  6171.480035: sched_wakeup: comm=kworker/1:1 pid=21 prio=120 success=1 target_cpu=001
3 过滤
许多事件与目标问题无关,例如调入、调出或唤醒 perf 自身的事件。
可以通过 --filter 去掉这些事件。
对每个使用 -e 指定的事件,在其后加入 --filter,
按字段值过滤跟踪事件::
root@crownbay:~# perf record -a -e sched:sched_switch --filter 'next_comm != perf && prev_comm != perf' -e sched:sched_wakeup --filter 'comm != perf'
^C[ perf record: Woken up 38 times to write data ]
[ perf record: Captured and wrote 9.688 MB perf.data (~423279 samples) ]


root@crownbay:~# perf script

        swapper     0 [000]  7932.162180: sched_switch: prev_comm=swapper/0 prev_pid=0 prev_prio=120 prev_state=R ==> next_comm=kworker/0:3 next_pid=1209 next_prio=120
    kworker/0:3  1209 [000]  7932.162236: sched_switch: prev_comm=kworker/0:3 prev_pid=1209 prev_prio=120 prev_state=S ==> next_comm=swapper/0 next_pid=0 next_prio=120
           perf  1407 [001]  7932.170048: sched_wakeup: comm=kworker/1:1 pid=21 prio=120 success=1 target_cpu=001
           perf  1407 [001]  7932.180044: sched_wakeup: comm=kworker/1:1 pid=21 prio=120 success=1 target_cpu=001
           perf  1407 [001]  7932.190038: sched_wakeup: comm=kworker/1:1 pid=21 prio=120 success=1 target_cpu=001
           perf  1407 [001]  7932.200044: sched_wakeup: comm=kworker/1:1 pid=21 prio=120 success=1 target_cpu=001
           perf  1407 [001]  7932.210044: sched_wakeup: comm=kworker/1:1 pid=21 prio=120 success=1 target_cpu=001
           perf  1407 [001]  7932.220044: sched_wakeup: comm=kworker/1:1 pid=21 prio=120 success=1 target_cpu=001
        swapper     0 [001]  7932.230111: sched_wakeup: comm=kworker/1:1 pid=21 prio=120 success=1 target_cpu=001
        swapper     0 [001]  7932.230146: sched_switch: prev_comm=swapper/1 prev_pid=0 prev_prio=120 prev_state=R ==> next_comm=kworker/1:1 next_pid=21 next_prio=120
    kworker/1:1    21 [001]  7932.230205: sched_switch: prev_comm=kworker/1:1 prev_pid=21 prev_prio=120 prev_state=S ==> next_comm=swapper/1 next_pid=0 next_prio=120
        swapper     0 [000]  7932.326109: sched_wakeup: comm=kworker/0:3 pid=1209 prio=120 success=1 target_cpu=000
        swapper     0 [000]  7932.326171: sched_switch: prev_comm=swapper/0 prev_pid=0 prev_prio=120 prev_state=R ==> next_comm=kworker/0:3 next_pid=1209 next_prio=120
    kworker/0:3  1209 [000]  7932.326214: sched_switch: prev_comm=kworker/0:3 prev_pid=1209 prev_prio=120 prev_state=S ==> next_comm=swapper/0 next_pid=0 next_prio=120
本例过滤掉 comm、comm_prev 或 comm_next 字段为 perf 的事件。
仍有一些与 perf 相关的事件留下,因为它们在被过滤字段中的值不是 perf。
要彻底过滤还需更多处理,但这个例子足以演示过滤器用法。
工具之间的联系
这正是 trace event 子系统定义的事件过滤器。 更多说明见 ftrace、trace-cmd 和 KernelShark 一节。
工具之间的联系
这些事件过滤器由内核中的专用伪解释器实现,是 perf 跟踪设计不可缺少的部分。 内核过滤器可以精确限制传入用户空间的事件流, 再由用户空间的通用编程语言绑定做后处理。 这种架构允许灵活地在内核和用户空间之间分配处理工作。 相比之下,SystemTap 将处理全部放在内核中,因此需要专用语言; LTTng 将所有事件发送到用户空间,因此需要高效的内核到用户空间传输机制。 perf 当然也能受益于传输机制的改进,但并不从根本上依赖它。 如果 perf 跟踪应用发生缓冲区 I/O 溢出,往往说明没有充分利用内核过滤引擎。
3 使用动态跟踪点
perf 不限于 perf list 列出的静态跟踪点,
用户还可以在内核任意位置添加动态跟踪点。
例如,使用 perf probe 为 do_fork() 定义跟踪点::
root@crownbay:~# perf probe do_fork
Added new event:
  probe:do_fork        (on do_fork)

You can now use it in all perf tools, such as:

  perf record -e probe:do_fork -aR sleep 1
通过 perf probe 添加后,会在 /sys/kernel/debug/tracing/events
中产生与静态跟踪点相同格式和文件结构的事件,详见 trace event 子系统一节::
root@crownbay:/sys/kernel/debug/tracing/events/probe/do_fork# ls -al
drwxr-xr-x    2 root     root             0 Oct 28 11:42 .
drwxr-xr-x    3 root     root             0 Oct 28 11:42 ..
-rw-r--r--    1 root     root             0 Oct 28 11:42 enable
-rw-r--r--    1 root     root             0 Oct 28 11:42 filter
-r--r--r--    1 root     root             0 Oct 28 11:42 format
-r--r--r--    1 root     root             0 Oct 28 11:42 id

root@crownbay:/sys/kernel/debug/tracing/events/probe/do_fork# cat format
name: do_fork
ID: 944
format:
        field:unsigned short common_type;    offset:0;       size:2; signed:0;
        field:unsigned char common_flags;    offset:2;       size:1; signed:0;
        field:unsigned char common_preempt_count;    offset:3;       size:1; signed:0;
        field:int common_pid;        offset:4;       size:4; signed:1;
        field:int common_padding;    offset:8;       size:4; signed:1;

        field:unsigned long __probe_ip;      offset:12;      size:4; signed:0;

print fmt: "(%lx)", REC->__probe_ip
列出当前全部动态跟踪点::
root@crownbay:~# perf probe -l
 probe:do_fork (on do_fork)
 probe:schedule (on schedule)
进行全系统记录。这里使用 sleep 30,让记录持续 30 秒而不执行其他工作::
root@crownbay:~# perf record -g -a -e probe:do_fork sleep 30
[ perf record: Woken up 1 times to write data ]
[ perf record: Captured and wrote 0.087 MB perf.data (~3812 samples) ]
使用 perf script 查看每次触发的 do_fork 事件::
root@crownbay:~# perf script

# ========
# captured on: Sun Oct 28 11:55:18 2012
# hostname : crownbay
# os release : 3.4.11-yocto-standard
# perf version : 3.4.11
# arch : i686
# nrcpus online : 2
# nrcpus avail : 2
# cpudesc : Intel(R) Atom(TM) CPU E660 @ 1.30GHz
# cpuid : GenuineIntel,6,38,1
# total memory : 1017184 kB
# cmdline : /usr/bin/perf record -g -a -e probe:do_fork sleep 30
# event : name = probe:do_fork, type = 2, config = 0x3b0, config1 = 0x0, config2 = 0x0, excl_usr = 0, excl_kern
 = 0, id = { 5, 6 }
# HEADER_CPU_TOPOLOGY info available, use -I to display
# ========
#
 matchbox-deskto  1197 [001] 34211.378318: do_fork: (c1028460)
 matchbox-deskto  1295 [001] 34211.380388: do_fork: (c1028460)
         pcmanfm  1296 [000] 34211.632350: do_fork: (c1028460)
         pcmanfm  1296 [000] 34211.639917: do_fork: (c1028460)
 matchbox-deskto  1197 [001] 34217.541603: do_fork: (c1028460)
 matchbox-deskto  1299 [001] 34217.543584: do_fork: (c1028460)
          gthumb  1300 [001] 34217.697451: do_fork: (c1028460)
          gthumb  1300 [001] 34219.085734: do_fork: (c1028460)
          gthumb  1300 [000] 34219.121351: do_fork: (c1028460)
          gthumb  1300 [001] 34219.264551: do_fork: (c1028460)
         pcmanfm  1296 [000] 34219.590380: do_fork: (c1028460)
 matchbox-deskto  1197 [001] 34224.955965: do_fork: (c1028460)
 matchbox-deskto  1306 [001] 34224.957972: do_fork: (c1028460)
 matchbox-termin  1307 [000] 34225.038214: do_fork: (c1028460)
 matchbox-termin  1307 [001] 34225.044218: do_fork: (c1028460)
 matchbox-termin  1307 [000] 34225.046442: do_fork: (c1028460)
 matchbox-deskto  1197 [001] 34237.112138: do_fork: (c1028460)
 matchbox-deskto  1311 [001] 34237.114106: do_fork: (c1028460)
            gaku  1312 [000] 34237.202388: do_fork: (c1028460)
对同一文件运行 perf report,可以看到这 30 秒内启动几个程序时产生的调用图:
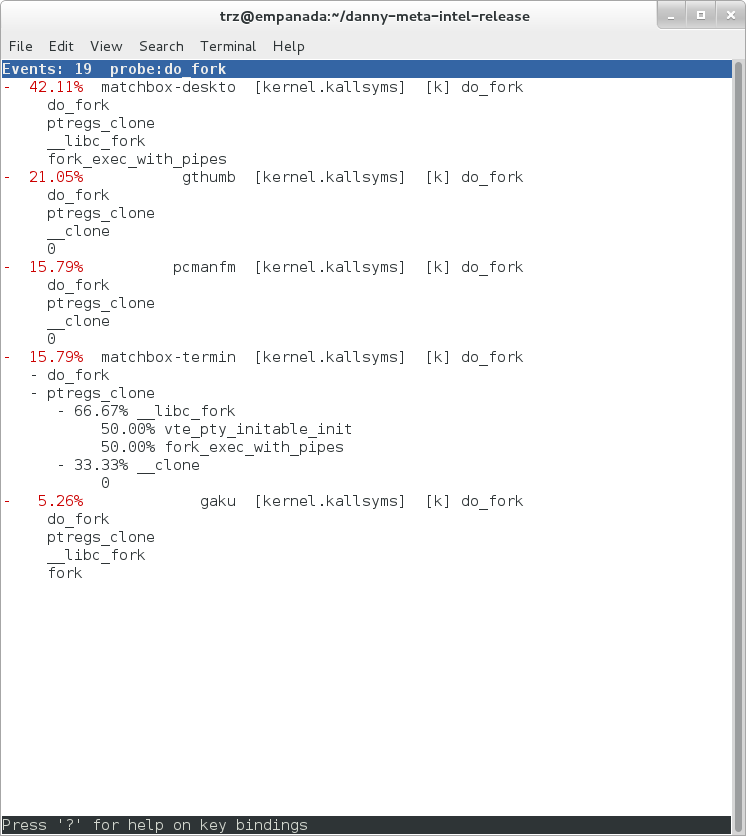
工具之间的联系
trace event 子系统对静态和动态跟踪点一视同仁,基础设施层面没有区别。 更多信息见 ftrace 一节。
工具之间的联系
动态跟踪点底层通过 Kprobes 和 Uprobes 实现。 SystemTap 也使用它们,实际上它们正是 SystemTap 的重点。
3 perf 文档
本节涉及命令的在线手册如下:
通常可以通过 perf 本身打开手册,例如 perf help 或 perf help record。
要在目标上安装 perf 手册页,修改配置如下::
IMAGE_INSTALL:append = " perf perf-doc"
DISTRO_FEATURES:append = " api-documentation"
文本形式的手册页,以及一组示例等文件,也可在内核树的 perf 目录找到::
tools/perf/Documentation
perf Wiki 还有一篇在某些方面更详细的 perf 教程。
3.2 ftrace
“ftrace”字面上指函数跟踪器,但实际涵盖多个相关跟踪器及其共用的基础设施。
3 配置 ftrace
本节假设已经完成 基本配置 所述的基本配置。
ftrace、trace-cmd 和 KernelShark 在目标系统上运行,开箱即用,无需额外配置。
下文假设通过 SSH 连接并在目标上运行 ftrace。
KernelShark 是图形应用;如有需要,可以通过 ssh -X
让它在目标运行、在主机远程显示。
3 ftrace 基本用法
ftrace 基本上指已挂载 debugfs 的 /tracing 目录中全部内容。
Yocto 遵循惯例,将 debugfs 挂载于 /sys/kernel/debug。
Yocto 系统的 /sys/kernel/debug/tracing 包含以下文件::
root@sugarbay:/sys/kernel/debug/tracing# ls
README                      kprobe_events               trace
available_events            kprobe_profile              trace_clock
available_filter_functions  options                     trace_marker
available_tracers           per_cpu                     trace_options
buffer_size_kb              printk_formats              trace_pipe
buffer_total_size_kb        saved_cmdlines              tracing_cpumask
current_tracer              set_event                   tracing_enabled
dyn_ftrace_total_info       set_ftrace_filter           tracing_on
enabled_functions           set_ftrace_notrace          tracing_thresh
events                      set_ftrace_pid
free_buffer                 set_graph_function
这些文件用途不同:一些直接控制跟踪器,一些设置跟踪选项, 还有一些在跟踪启用时保存输出。部分名称可以直接说明用途,其他则需要解释。 下文介绍其中一些文件,其余请参考 ftrace 文档。
先查看内置跟踪器。available_tracers 列出可用跟踪器::
root@sugarbay:/sys/kernel/debug/tracing# cat available_tracers
blk function_graph function nop
current_tracer 包含当前生效的跟踪器::
root@sugarbay:/sys/kernel/debug/tracing# cat current_tracer
nop
上例为 nop,表示当前没有实际启用跟踪器。
将可用跟踪器名称写入 current_tracer,即可选择它::
root@sugarbay:/sys/kernel/debug/tracing# echo function > current_tracer
root@sugarbay:/sys/kernel/debug/tracing# cat current_tracer
function
上例选择 function,它记录内核中的每次函数调用,并通过 trace 文件提供结果。
读取该文件,可以查看当前缓冲区中已记录的函数调用::
root@sugarbay:/sys/kernel/debug/tracing# cat trace | less

# tracer: function
#
# entries-in-buffer/entries-written: 310629/766471   #P:8
#
#                              _-----=> irqs-off
#                             / _----=> need-resched
#                            | / _---=> hardirq/softirq
#                            || / _--=> preempt-depth
#                            ||| /     delay
#           TASK-PID   CPU#  ||||    TIMESTAMP  FUNCTION
#              | |       |   ||||       |         |
         <idle>-0     [004] d..1   470.867169: ktime_get_real <-intel_idle
         <idle>-0     [004] d..1   470.867170: getnstimeofday <-ktime_get_real
         <idle>-0     [004] d..1   470.867171: ns_to_timeval <-intel_idle
         <idle>-0     [004] d..1   470.867171: ns_to_timespec <-ns_to_timeval
         <idle>-0     [004] d..1   470.867172: smp_apic_timer_interrupt <-apic_timer_interrupt
         <idle>-0     [004] d..1   470.867172: native_apic_mem_write <-smp_apic_timer_interrupt
         <idle>-0     [004] d..1   470.867172: irq_enter <-smp_apic_timer_interrupt
         <idle>-0     [004] d..1   470.867172: rcu_irq_enter <-irq_enter
         <idle>-0     [004] d..1   470.867173: rcu_idle_exit_common.isra.33 <-rcu_irq_enter
         <idle>-0     [004] d..1   470.867173: local_bh_disable <-irq_enter
         <idle>-0     [004] d..1   470.867173: add_preempt_count <-local_bh_disable
         <idle>-0     [004] d.s1   470.867174: tick_check_idle <-irq_enter
         <idle>-0     [004] d.s1   470.867174: tick_check_oneshot_broadcast <-tick_check_idle
         <idle>-0     [004] d.s1   470.867174: ktime_get <-tick_check_idle
         <idle>-0     [004] d.s1   470.867174: tick_nohz_stop_idle <-tick_check_idle
         <idle>-0     [004] d.s1   470.867175: update_ts_time_stats <-tick_nohz_stop_idle
         <idle>-0     [004] d.s1   470.867175: nr_iowait_cpu <-update_ts_time_stats
         <idle>-0     [004] d.s1   470.867175: tick_do_update_jiffies64 <-tick_check_idle
         <idle>-0     [004] d.s1   470.867175: _raw_spin_lock <-tick_do_update_jiffies64
         <idle>-0     [004] d.s1   470.867176: add_preempt_count <-_raw_spin_lock
         <idle>-0     [004] d.s2   470.867176: do_timer <-tick_do_update_jiffies64
         <idle>-0     [004] d.s2   470.867176: _raw_spin_lock <-do_timer
         <idle>-0     [004] d.s2   470.867176: add_preempt_count <-_raw_spin_lock
         <idle>-0     [004] d.s3   470.867177: ntp_tick_length <-do_timer
         <idle>-0     [004] d.s3   470.867177: _raw_spin_lock_irqsave <-ntp_tick_length
         .
         .
         .
每行展示某个 CPU 上发生的内核函数调用,先是被调用函数,箭头后是调用者。
函数跟踪器能非常详细地展示当时内核在做什么,适合从动态执行角度理解内核代码。
工具之间的联系
perf 也可以通过 ftrace:function 跟踪点使用 ftrace 函数跟踪器。
直接从上述格式跟随调用链有些困难。
function_graph 变体可以显式展示调用关系::
root@sugarbay:/sys/kernel/debug/tracing# echo function_graph > current_tracer
root@sugarbay:/sys/kernel/debug/tracing# cat trace | less

 tracer: function_graph

 CPU  DURATION                  FUNCTION CALLS
 |     |   |                     |   |   |   |
7)   0.046 us    |      pick_next_task_fair();
7)   0.043 us    |      pick_next_task_stop();
7)   0.042 us    |      pick_next_task_rt();
7)   0.032 us    |      pick_next_task_fair();
7)   0.030 us    |      pick_next_task_idle();
7)               |      _raw_spin_unlock_irq() {
7)   0.033 us    |        sub_preempt_count();
7)   0.258 us    |      }
7)   0.032 us    |      sub_preempt_count();
7) + 13.341 us   |    } /* __schedule */
7)   0.095 us    |  } /* sub_preempt_count */
7)               |  schedule() {
7)               |    __schedule() {
7)   0.060 us    |      add_preempt_count();
7)   0.044 us    |      rcu_note_context_switch();
7)               |      _raw_spin_lock_irq() {
7)   0.033 us    |        add_preempt_count();
7)   0.247 us    |      }
7)               |      idle_balance() {
7)               |        _raw_spin_unlock() {
7)   0.031 us    |          sub_preempt_count();
7)   0.246 us    |        }
7)               |        update_shares() {
7)   0.030 us    |          __rcu_read_lock();
7)   0.029 us    |          __rcu_read_unlock();
7)   0.484 us    |        }
7)   0.030 us    |        __rcu_read_lock();
7)               |        load_balance() {
7)               |          find_busiest_group() {
7)   0.031 us    |            idle_cpu();
7)   0.029 us    |            idle_cpu();
7)   0.035 us    |            idle_cpu();
7)   0.906 us    |          }
7)   1.141 us    |        }
7)   0.022 us    |        msecs_to_jiffies();
7)               |        load_balance() {
7)               |          find_busiest_group() {
7)   0.031 us    |            idle_cpu();
.
.
.
4)   0.062 us    |        msecs_to_jiffies();
4)   0.062 us    |        __rcu_read_unlock();
4)               |        _raw_spin_lock() {
4)   0.073 us    |          add_preempt_count();
4)   0.562 us    |        }
4) + 17.452 us   |      }
4)   0.108 us    |      put_prev_task_fair();
4)   0.102 us    |      pick_next_task_fair();
4)   0.084 us    |      pick_next_task_stop();
4)   0.075 us    |      pick_next_task_rt();
4)   0.062 us    |      pick_next_task_fair();
4)   0.066 us    |      pick_next_task_idle();
------------------------------------------
4)   kworker-74   =>    <idle>-0
------------------------------------------

4)               |      finish_task_switch() {
4)               |        _raw_spin_unlock_irq() {
4)   0.100 us    |          sub_preempt_count();
4)   0.582 us    |        }
4)   1.105 us    |      }
4)   0.088 us    |      sub_preempt_count();
4) ! 100.066 us  |    }
.
.
.
3)               |  sys_ioctl() {
3)   0.083 us    |    fget_light();
3)               |    security_file_ioctl() {
3)   0.066 us    |      cap_file_ioctl();
3)   0.562 us    |    }
3)               |    do_vfs_ioctl() {
3)               |      drm_ioctl() {
3)   0.075 us    |        drm_ut_debug_printk();
3)               |        i915_gem_pwrite_ioctl() {
3)               |          i915_mutex_lock_interruptible() {
3)   0.070 us    |            mutex_lock_interruptible();
3)   0.570 us    |          }
3)               |          drm_gem_object_lookup() {
3)               |            _raw_spin_lock() {
3)   0.080 us    |              add_preempt_count();
3)   0.620 us    |            }
3)               |            _raw_spin_unlock() {
3)   0.085 us    |              sub_preempt_count();
3)   0.562 us    |            }
3)   2.149 us    |          }
3)   0.133 us    |          i915_gem_object_pin();
3)               |          i915_gem_object_set_to_gtt_domain() {
3)   0.065 us    |            i915_gem_object_flush_gpu_write_domain();
3)   0.065 us    |            i915_gem_object_wait_rendering();
3)   0.062 us    |            i915_gem_object_flush_cpu_write_domain();
3)   1.612 us    |          }
3)               |          i915_gem_object_put_fence() {
3)   0.097 us    |            i915_gem_object_flush_fence.constprop.36();
3)   0.645 us    |          }
3)   0.070 us    |          add_preempt_count();
3)   0.070 us    |          sub_preempt_count();
3)   0.073 us    |          i915_gem_object_unpin();
3)   0.068 us    |          mutex_unlock();
3)   9.924 us    |        }
3) + 11.236 us   |      }
3) + 11.770 us   |    }
3) + 13.784 us   |  }
3)               |  sys_ioctl() {
可以看到,function_graph 更容易阅读。
除了函数调用及对应花括号,它还会在上下文中显示调度器等其他事件。
只需启用下一节 trace event 子系统中的任意跟踪点,
它们就会出现在函数图中,便于理解内核动态行为。
显示左侧还有一些标记。例如,函数总执行时间超过特定阈值时, 会出现感叹号或加号。各字段含义请参见 ftrace 文档。
3 trace event 子系统
/sys/kernel/debug/tracing 中尤其重要的是 events 子目录,
其中呈现系统的全部跟踪点。列出其内容,会看到一组子目录::
root@sugarbay:/sys/kernel/debug/tracing# cd events
root@sugarbay:/sys/kernel/debug/tracing/events# ls -al
drwxr-xr-x   38 root     root             0 Nov 14 23:19 .
drwxr-xr-x    5 root     root             0 Nov 14 23:19 ..
drwxr-xr-x   19 root     root             0 Nov 14 23:19 block
drwxr-xr-x   32 root     root             0 Nov 14 23:19 btrfs
drwxr-xr-x    5 root     root             0 Nov 14 23:19 drm
-rw-r--r--    1 root     root             0 Nov 14 23:19 enable
drwxr-xr-x   40 root     root             0 Nov 14 23:19 ext3
drwxr-xr-x   79 root     root             0 Nov 14 23:19 ext4
drwxr-xr-x   14 root     root             0 Nov 14 23:19 ftrace
drwxr-xr-x    8 root     root             0 Nov 14 23:19 hda
-r--r--r--    1 root     root             0 Nov 14 23:19 header_event
-r--r--r--    1 root     root             0 Nov 14 23:19 header_page
drwxr-xr-x   25 root     root             0 Nov 14 23:19 i915
drwxr-xr-x    7 root     root             0 Nov 14 23:19 irq
drwxr-xr-x   12 root     root             0 Nov 14 23:19 jbd
drwxr-xr-x   14 root     root             0 Nov 14 23:19 jbd2
drwxr-xr-x   14 root     root             0 Nov 14 23:19 kmem
drwxr-xr-x    7 root     root             0 Nov 14 23:19 module
drwxr-xr-x    3 root     root             0 Nov 14 23:19 napi
drwxr-xr-x    6 root     root             0 Nov 14 23:19 net
drwxr-xr-x    3 root     root             0 Nov 14 23:19 oom
drwxr-xr-x   12 root     root             0 Nov 14 23:19 power
drwxr-xr-x    3 root     root             0 Nov 14 23:19 printk
drwxr-xr-x    8 root     root             0 Nov 14 23:19 random
drwxr-xr-x    4 root     root             0 Nov 14 23:19 raw_syscalls
drwxr-xr-x    3 root     root             0 Nov 14 23:19 rcu
drwxr-xr-x    6 root     root             0 Nov 14 23:19 rpm
drwxr-xr-x   20 root     root             0 Nov 14 23:19 sched
drwxr-xr-x    7 root     root             0 Nov 14 23:19 scsi
drwxr-xr-x    4 root     root             0 Nov 14 23:19 signal
drwxr-xr-x    5 root     root             0 Nov 14 23:19 skb
drwxr-xr-x    4 root     root             0 Nov 14 23:19 sock
drwxr-xr-x   10 root     root             0 Nov 14 23:19 sunrpc
drwxr-xr-x  538 root     root             0 Nov 14 23:19 syscalls
drwxr-xr-x    4 root     root             0 Nov 14 23:19 task
drwxr-xr-x   14 root     root             0 Nov 14 23:19 timer
drwxr-xr-x    3 root     root             0 Nov 14 23:19 udp
drwxr-xr-x   21 root     root             0 Nov 14 23:19 vmscan
drwxr-xr-x    3 root     root             0 Nov 14 23:19 vsyscall
drwxr-xr-x    6 root     root             0 Nov 14 23:19 workqueue
drwxr-xr-x   26 root     root             0 Nov 14 23:19 writeback
每个子目录对应一个子系统,其中进一步的子目录才对应具体跟踪点。
例如,kmem 子系统包含::
root@sugarbay:/sys/kernel/debug/tracing/events# cd kmem
root@sugarbay:/sys/kernel/debug/tracing/events/kmem# ls -al
drwxr-xr-x   14 root     root             0 Nov 14 23:19 .
drwxr-xr-x   38 root     root             0 Nov 14 23:19 ..
-rw-r--r--    1 root     root             0 Nov 14 23:19 enable
-rw-r--r--    1 root     root             0 Nov 14 23:19 filter
drwxr-xr-x    2 root     root             0 Nov 14 23:19 kfree
drwxr-xr-x    2 root     root             0 Nov 14 23:19 kmalloc
drwxr-xr-x    2 root     root             0 Nov 14 23:19 kmalloc_node
drwxr-xr-x    2 root     root             0 Nov 14 23:19 kmem_cache_alloc
drwxr-xr-x    2 root     root             0 Nov 14 23:19 kmem_cache_alloc_node
drwxr-xr-x    2 root     root             0 Nov 14 23:19 kmem_cache_free
drwxr-xr-x    2 root     root             0 Nov 14 23:19 mm_page_alloc
drwxr-xr-x    2 root     root             0 Nov 14 23:19 mm_page_alloc_extfrag
drwxr-xr-x    2 root     root             0 Nov 14 23:19 mm_page_alloc_zone_locked
drwxr-xr-x    2 root     root             0 Nov 14 23:19 mm_page_free
drwxr-xr-x    2 root     root             0 Nov 14 23:19 mm_page_free_batched
drwxr-xr-x    2 root     root             0 Nov 14 23:19 mm_page_pcpu_drain
再查看特定跟踪点 kmalloc 的目录::
root@sugarbay:/sys/kernel/debug/tracing/events/kmem# cd kmalloc
root@sugarbay:/sys/kernel/debug/tracing/events/kmem/kmalloc# ls -al
drwxr-xr-x    2 root     root             0 Nov 14 23:19 .
drwxr-xr-x   14 root     root             0 Nov 14 23:19 ..
-rw-r--r--    1 root     root             0 Nov 14 23:19 enable
-rw-r--r--    1 root     root             0 Nov 14 23:19 filter
-r--r--r--    1 root     root             0 Nov 14 23:19 format
-r--r--r--    1 root     root             0 Nov 14 23:19 id
format 描述事件在内存中的布局,供使用这些跟踪点的工具解析事件。
其中的 print fmt 字段使 ftrace 等工具能够以文本显示事件。
kmalloc 事件格式如下::
root@sugarbay:/sys/kernel/debug/tracing/events/kmem/kmalloc# cat format
name: kmalloc
ID: 313
format:
        field:unsigned short common_type;    offset:0;       size:2; signed:0;
        field:unsigned char common_flags;    offset:2;       size:1; signed:0;
        field:unsigned char common_preempt_count;    offset:3;       size:1; signed:0;
        field:int common_pid;        offset:4;       size:4; signed:1;
        field:int common_padding;    offset:8;       size:4; signed:1;

        field:unsigned long call_site;       offset:16;      size:8; signed:0;
        field:const void * ptr;      offset:24;      size:8; signed:0;
        field:size_t bytes_req;      offset:32;      size:8; signed:0;
        field:size_t bytes_alloc;    offset:40;      size:8; signed:0;
        field:gfp_t gfp_flags;       offset:48;      size:4; signed:0;

print fmt: "call_site=%lx ptr=%p bytes_req=%zu bytes_alloc=%zu gfp_flags=%s", REC->call_site, REC->ptr, REC->bytes_req, REC->bytes_alloc,
(REC->gfp_flags) ? __print_flags(REC->gfp_flags, "|", {(unsigned long)(((( gfp_t)0x10u) | (( gfp_t)0x40u) | (( gfp_t)0x80u) | ((
gfp_t)0x20000u) | (( gfp_t)0x02u) | (( gfp_t)0x08u)) | (( gfp_t)0x4000u) | (( gfp_t)0x10000u) | (( gfp_t)0x1000u) | (( gfp_t)0x200u) | ((
gfp_t)0x400000u)), "GFP_TRANSHUGE"}, {(unsigned long)((( gfp_t)0x10u) | (( gfp_t)0x40u) | (( gfp_t)0x80u) | (( gfp_t)0x20000u) | ((
gfp_t)0x02u) | (( gfp_t)0x08u)), "GFP_HIGHUSER_MOVABLE"}, {(unsigned long)((( gfp_t)0x10u) | (( gfp_t)0x40u) | (( gfp_t)0x80u) | ((
gfp_t)0x20000u) | (( gfp_t)0x02u)), "GFP_HIGHUSER"}, {(unsigned long)((( gfp_t)0x10u) | (( gfp_t)0x40u) | (( gfp_t)0x80u) | ((
gfp_t)0x20000u)), "GFP_USER"}, {(unsigned long)((( gfp_t)0x10u) | (( gfp_t)0x40u) | (( gfp_t)0x80u) | (( gfp_t)0x80000u)), GFP_TEMPORARY"},
{(unsigned long)((( gfp_t)0x10u) | (( gfp_t)0x40u) | (( gfp_t)0x80u)), "GFP_KERNEL"}, {(unsigned long)((( gfp_t)0x10u) | (( gfp_t)0x40u)),
"GFP_NOFS"}, {(unsigned long)((( gfp_t)0x20u)), "GFP_ATOMIC"}, {(unsigned long)((( gfp_t)0x10u)), "GFP_NOIO"}, {(unsigned long)((
gfp_t)0x20u), "GFP_HIGH"}, {(unsigned long)(( gfp_t)0x10u), "GFP_WAIT"}, {(unsigned long)(( gfp_t)0x40u), "GFP_IO"}, {(unsigned long)((
gfp_t)0x100u), "GFP_COLD"}, {(unsigned long)(( gfp_t)0x200u), "GFP_NOWARN"}, {(unsigned long)(( gfp_t)0x400u), "GFP_REPEAT"}, {(unsigned
long)(( gfp_t)0x800u), "GFP_NOFAIL"}, {(unsigned long)(( gfp_t)0x1000u), "GFP_NORETRY"},      {(unsigned long)(( gfp_t)0x4000u), "GFP_COMP"},
{(unsigned long)(( gfp_t)0x8000u), "GFP_ZERO"}, {(unsigned long)(( gfp_t)0x10000u), "GFP_NOMEMALLOC"}, {(unsigned long)(( gfp_t)0x20000u),
"GFP_HARDWALL"}, {(unsigned long)(( gfp_t)0x40000u), "GFP_THISNODE"}, {(unsigned long)(( gfp_t)0x80000u), "GFP_RECLAIMABLE"}, {(unsigned
long)(( gfp_t)0x08u), "GFP_MOVABLE"}, {(unsigned long)(( gfp_t)0), "GFP_NOTRACK"}, {(unsigned long)(( gfp_t)0x400000u), "GFP_NO_KSWAPD"},
{(unsigned long)(( gfp_t)0x800000u), "GFP_OTHER_NODE"} ) : "GFP_NOWAIT"
跟踪点目录中的 enable 允许用户或 trace-cmd 等工具启停该跟踪点。
启用后,事件会出现在前述 ftrace 的 trace 文件中。
例如,启用 kmalloc::
root@sugarbay:/sys/kernel/debug/tracing/events/kmem/kmalloc# echo 1 > enable
当前不需要函数跟踪器或其他跟踪器,先将其关闭。 但仍需启用跟踪,事件才会进入输出缓冲区::
root@sugarbay:/sys/kernel/debug/tracing# echo nop > current_tracer
root@sugarbay:/sys/kernel/debug/tracing# echo 1 > tracing_on
此时查看 trace,只会看到刚启用的 kmalloc 事件::
root@sugarbay:/sys/kernel/debug/tracing# cat trace | less
# tracer: nop
#
# entries-in-buffer/entries-written: 1897/1897   #P:8
#
#                              _-----=> irqs-off
#                             / _----=> need-resched
#                            | / _---=> hardirq/softirq
#                            || / _--=> preempt-depth
#                            ||| /     delay
#           TASK-PID   CPU#  ||||    TIMESTAMP  FUNCTION
#              | |       |   ||||       |         |
       dropbear-1465  [000] ...1 18154.620753: kmalloc: call_site=ffffffff816650d4 ptr=ffff8800729c3000 bytes_req=2048 bytes_alloc=2048 gfp_flags=GFP_KERNEL
         <idle>-0     [000] ..s3 18154.621640: kmalloc: call_site=ffffffff81619b36 ptr=ffff88006d555800 bytes_req=512 bytes_alloc=512 gfp_flags=GFP_ATOMIC
         <idle>-0     [000] ..s3 18154.621656: kmalloc: call_site=ffffffff81619b36 ptr=ffff88006d555800 bytes_req=512 bytes_alloc=512 gfp_flags=GFP_ATOMIC
matchbox-termin-1361  [001] ...1 18154.755472: kmalloc: call_site=ffffffff81614050 ptr=ffff88006d5f0e00 bytes_req=512 bytes_alloc=512 gfp_flags=GFP_KERNEL|GFP_REPEAT
           Xorg-1264  [002] ...1 18154.755581: kmalloc: call_site=ffffffff8141abe8 ptr=ffff8800734f4cc0 bytes_req=168 bytes_alloc=192 gfp_flags=GFP_KERNEL|GFP_NOWARN|GFP_NORETRY
           Xorg-1264  [002] ...1 18154.755583: kmalloc: call_site=ffffffff814192a3 ptr=ffff88001f822520 bytes_req=24 bytes_alloc=32 gfp_flags=GFP_KERNEL|GFP_ZERO
           Xorg-1264  [002] ...1 18154.755589: kmalloc: call_site=ffffffff81419edb ptr=ffff8800721a2f00 bytes_req=64 bytes_alloc=64 gfp_flags=GFP_KERNEL|GFP_ZERO
matchbox-termin-1361  [001] ...1 18155.354594: kmalloc: call_site=ffffffff81614050 ptr=ffff88006db35400 bytes_req=576 bytes_alloc=1024 gfp_flags=GFP_KERNEL|GFP_REPEAT
           Xorg-1264  [002] ...1 18155.354703: kmalloc: call_site=ffffffff8141abe8 ptr=ffff8800734f4cc0 bytes_req=168 bytes_alloc=192 gfp_flags=GFP_KERNEL|GFP_NOWARN|GFP_NORETRY
           Xorg-1264  [002] ...1 18155.354705: kmalloc: call_site=ffffffff814192a3 ptr=ffff88001f822520 bytes_req=24 bytes_alloc=32 gfp_flags=GFP_KERNEL|GFP_ZERO
           Xorg-1264  [002] ...1 18155.354711: kmalloc: call_site=ffffffff81419edb ptr=ffff8800721a2f00 bytes_req=64 bytes_alloc=64 gfp_flags=GFP_KERNEL|GFP_ZERO
         <idle>-0     [000] ..s3 18155.673319: kmalloc: call_site=ffffffff81619b36 ptr=ffff88006d555800 bytes_req=512 bytes_alloc=512 gfp_flags=GFP_ATOMIC
       dropbear-1465  [000] ...1 18155.673525: kmalloc: call_site=ffffffff816650d4 ptr=ffff8800729c3000 bytes_req=2048 bytes_alloc=2048 gfp_flags=GFP_KERNEL
         <idle>-0     [000] ..s3 18155.674821: kmalloc: call_site=ffffffff81619b36 ptr=ffff88006d554800 bytes_req=512 bytes_alloc=512 gfp_flags=GFP_ATOMIC
         <idle>-0     [000] ..s3 18155.793014: kmalloc: call_site=ffffffff81619b36 ptr=ffff88006d554800 bytes_req=512 bytes_alloc=512 gfp_flags=GFP_ATOMIC
       dropbear-1465  [000] ...1 18155.793219: kmalloc: call_site=ffffffff816650d4 ptr=ffff8800729c3000 bytes_req=2048 bytes_alloc=2048 gfp_flags=GFP_KERNEL
         <idle>-0     [000] ..s3 18155.794147: kmalloc: call_site=ffffffff81619b36 ptr=ffff88006d555800 bytes_req=512 bytes_alloc=512 gfp_flags=GFP_ATOMIC
         <idle>-0     [000] ..s3 18155.936705: kmalloc: call_site=ffffffff81619b36 ptr=ffff88006d555800 bytes_req=512 bytes_alloc=512 gfp_flags=GFP_ATOMIC
       dropbear-1465  [000] ...1 18155.936910: kmalloc: call_site=ffffffff816650d4 ptr=ffff8800729c3000 bytes_req=2048 bytes_alloc=2048 gfp_flags=GFP_KERNEL
         <idle>-0     [000] ..s3 18155.937869: kmalloc: call_site=ffffffff81619b36 ptr=ffff88006d554800 bytes_req=512 bytes_alloc=512 gfp_flags=GFP_ATOMIC
matchbox-termin-1361  [001] ...1 18155.953667: kmalloc: call_site=ffffffff81614050 ptr=ffff88006d5f2000 bytes_req=512 bytes_alloc=512 gfp_flags=GFP_KERNEL|GFP_REPEAT
           Xorg-1264  [002] ...1 18155.953775: kmalloc: call_site=ffffffff8141abe8 ptr=ffff8800734f4cc0 bytes_req=168 bytes_alloc=192 gfp_flags=GFP_KERNEL|GFP_NOWARN|GFP_NORETRY
           Xorg-1264  [002] ...1 18155.953777: kmalloc: call_site=ffffffff814192a3 ptr=ffff88001f822520 bytes_req=24 bytes_alloc=32 gfp_flags=GFP_KERNEL|GFP_ZERO
           Xorg-1264  [002] ...1 18155.953783: kmalloc: call_site=ffffffff81419edb ptr=ffff8800721a2f00 bytes_req=64 bytes_alloc=64 gfp_flags=GFP_KERNEL|GFP_ZERO
         <idle>-0     [000] ..s3 18156.176053: kmalloc: call_site=ffffffff81619b36 ptr=ffff88006d554800 bytes_req=512 bytes_alloc=512 gfp_flags=GFP_ATOMIC
       dropbear-1465  [000] ...1 18156.176257: kmalloc: call_site=ffffffff816650d4 ptr=ffff8800729c3000 bytes_req=2048 bytes_alloc=2048 gfp_flags=GFP_KERNEL
         <idle>-0     [000] ..s3 18156.177717: kmalloc: call_site=ffffffff81619b36 ptr=ffff88006d555800 bytes_req=512 bytes_alloc=512 gfp_flags=GFP_ATOMIC
         <idle>-0     [000] ..s3 18156.399229: kmalloc: call_site=ffffffff81619b36 ptr=ffff88006d555800 bytes_req=512 bytes_alloc=512 gfp_flags=GFP_ATOMIC
       dropbear-1465  [000] ...1 18156.399434: kmalloc: call_site=ffffffff816650d4 ptr=ffff8800729c3000 bytes_http://rostedt.homelinux.com/kernelshark/req=2048 bytes_alloc=2048 gfp_flags=GFP_KERNEL
         <idle>-0     [000] ..s3 18156.400660: kmalloc: call_site=ffffffff81619b36 ptr=ffff88006d554800 bytes_req=512 bytes_alloc=512 gfp_flags=GFP_ATOMIC
matchbox-termin-1361  [001] ...1 18156.552800: kmalloc: call_site=ffffffff81614050 ptr=ffff88006db34800 bytes_req=576 bytes_alloc=1024 gfp_flags=GFP_KERNEL|GFP_REPEAT
向 enable 写入 0,即可再次禁用::
root@sugarbay:/sys/kernel/debug/tracing/events/kmem/kmalloc# echo 0 > enable
可以启用任意数量的事件,也可以使用子系统目录中的 enable 启用整个子系统。
启用足够多的相关跟踪点,就能获得细粒度的系统行为信息。
本指南中的多个工具都采用此方式,包括下一节的 trace-cmd 和 KernelShark。
工具之间的联系
这些跟踪点及其表示不仅供 ftrace 使用,也供本指南中的许多其他工具使用, 是 Linux 各跟踪器的重要集成点。 它们构成 perf、LTTng、ftrace、blktrace 和 SystemTap 的核心插桩基础。
工具之间的联系
/sys/kernel/debug/tracing 中现有的专用跟踪器,
最终将被基于 trace event 子系统的等效跟踪器取代。
3.2.4 trace-cmd / KernelShark
trace-cmd 是较完整的命令行包装接口,隐藏了
/sys/kernel/debug/tracing 中各个文件的细节。
用户可以直接选择 /sys/kernel/debug/tracing/events/ 中的事件并收集跟踪,
无需手动处理这些文件。
KernelShark 在其之上提供图形界面,可直观地启停跟踪、选择事件集合, 并以事件列表和按 CPU 展示的图形查看结果。 底层直接使用 trace-cmd 完成操作,也会显示实际使用的命令。
先启动 KernelShark::
root@sugarbay:~# kernelshark
通过菜单打开 Capture 对话框::
Capture | Record
对话框允许选择一个或多个事件,甚至整个子系统:
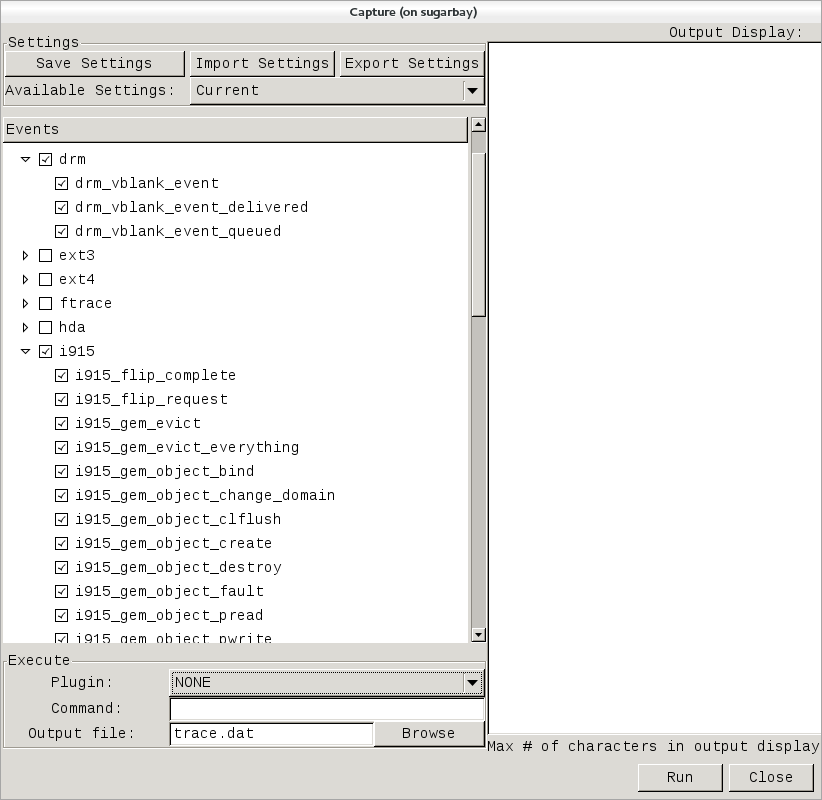
这里的事件集合与上一节完全相同,trace-cmd 正是从 trace event 子系统取得它们。
图中为了探索图形子系统,选择了 i915 和 drm 的全部跟踪点。
通过对话框右下角的 Run 和 Stop 按钮启停跟踪;
开始后,同一个按钮会变成 Stop:
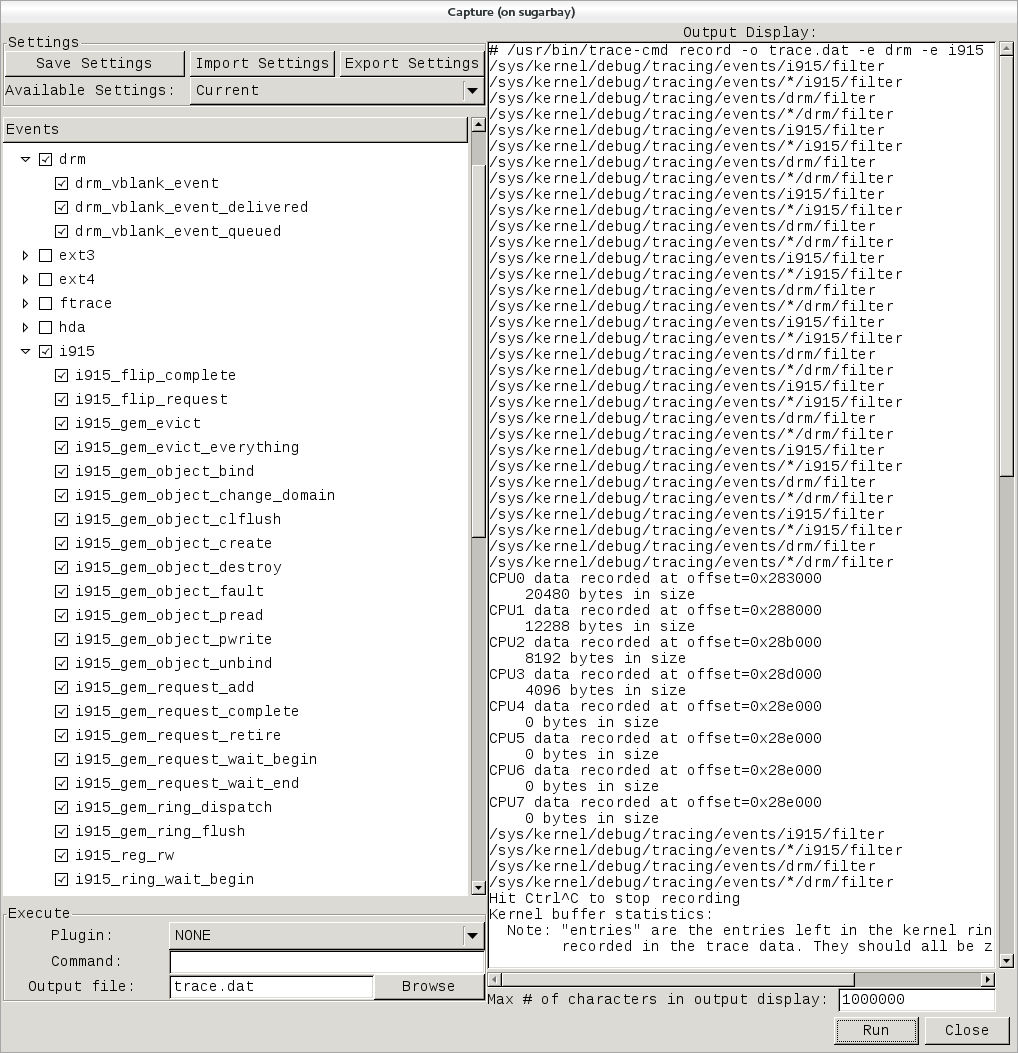
右侧面板显示实际执行的 trace-cmd 命令行及其运行结果。
按下 Stop 后,图形区域会按 CPU 用不同颜色显示跟踪数据,
下方则是详细事件列表:
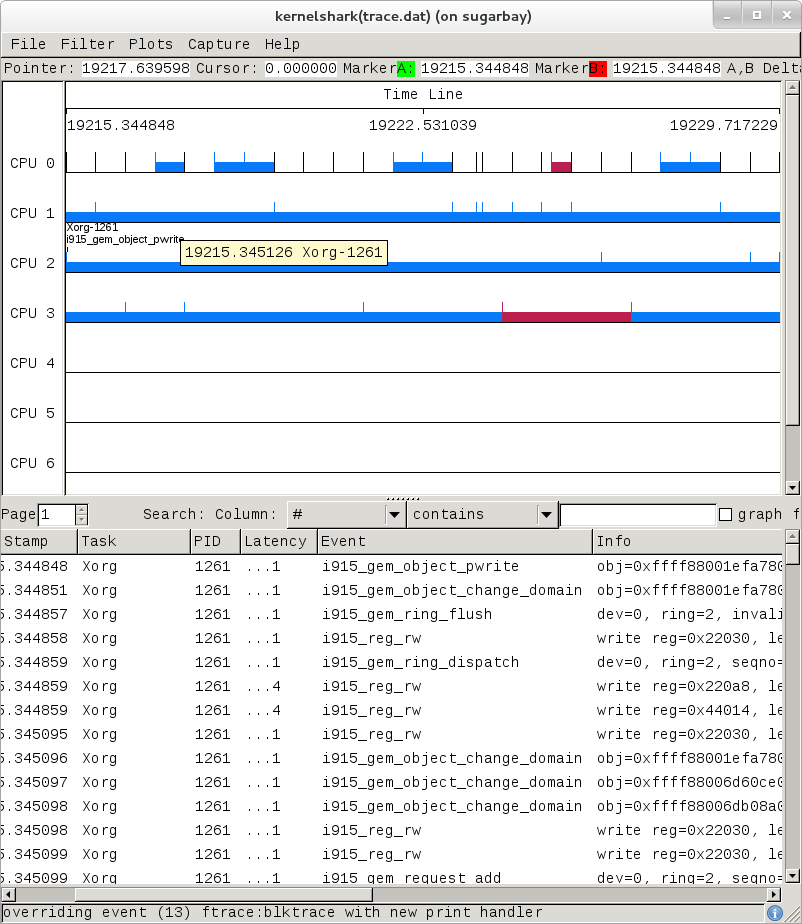
下面是跟踪 all events 的另一个示例:
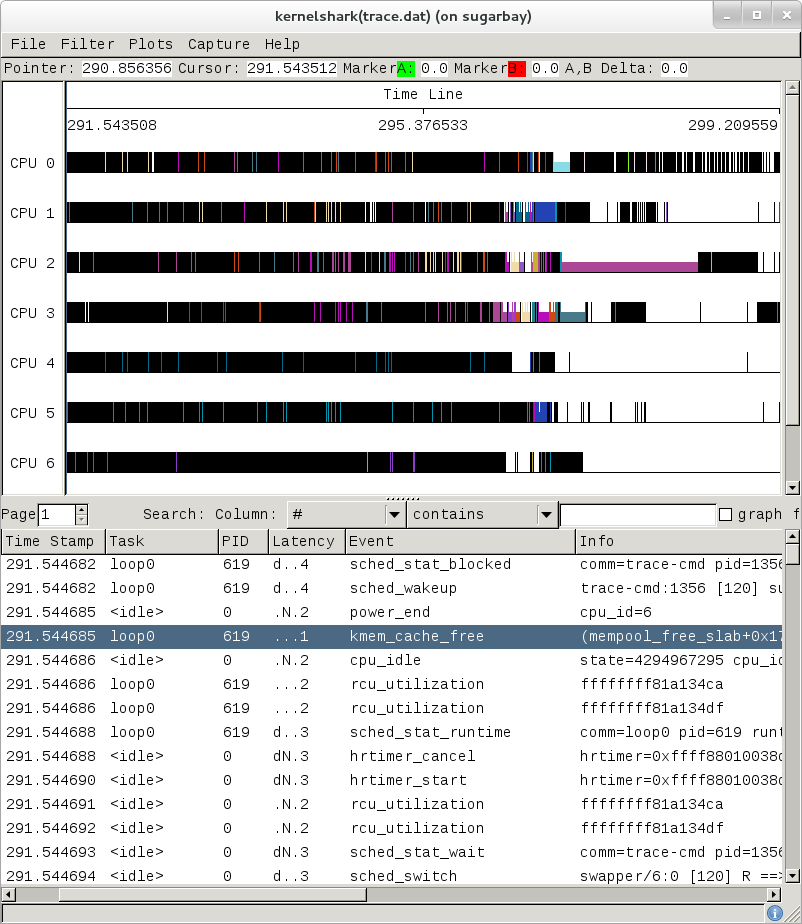
工具较为直观,浏览数据的更多操作详见 KernelShark 网站。
3 ftrace 文档
ftrace 文档位于内核 Documentation 目录::
Documentation/trace/ftrace.txt
trace event 子系统的文档也位于该目录::
Documentation/trace/events.txt
LWN 上有一组介绍 ftrace 和 trace-cmd 的文章:
更多用法参见 KernelShark 文档。
/sys/kernel/debug/tracing/README 中还有一篇简短、有趣且实用的跟踪指南。
3.3 SystemTap
SystemTap 是基于脚本的全系统跟踪与性能分析工具。
其脚本类似 C 程序,在内核中执行,从被调用时的上下文中收集、打印或聚合数据。
例如,SystemTap 教程
中的以下探针,会在系统任意进程对文件调用 open() 时打印一行。
每行包含打开文件的程序可执行文件名、PID,以及尝试打开的文件名;
文件名从系统调用参数字符串 argstr 中提取。
probe syscall.open
{
        printf ("%s(%d) open (%s)\n", execname(), pid(), argstr)
}

probe timer.ms(4000) # after 4 seconds
{
        exit ()
}
通常,只需在被探测系统上安装 SystemTap,直接运行脚本即可。
假设上述内容保存在 trace_open.stp::
# stap trace_open.stp
SystemTap 在底层依次执行:解析并将探针转换成等效 C 代码; 将 C 代码编译为内核模块;加载模块以启用探针;收集并显示探针生成的数据。
前两步要求 stap 能访问构建当前运行内核的构建系统。
典型嵌入式目标镜像通常不包含内核构建系统,
但生成该镜像的主机上通常具备它。
因此,前两步在主机执行,后两步在目标执行,目标只需 SystemTap 运行时。
Yocto 的 SystemTap 支持以这种方式为前提。 虽然也可以在目标上完成全部步骤,本节只考虑典型嵌入式场景。
因此,在目标上运行脚本需要:在主机将探针编译成适用于目标的内核模块; 复制模块到目标;在目标内核加载并启用;收集数据并显示给用户。
3 配置 SystemTap
这些步骤涉及不少细节,Yocto 的 crosstap 脚本可以代为处理,
让你直接在远程目标执行 SystemTap 脚本,必要时传入参数。
但从远程主机操作时,必须能访问当前已启动镜像对应的构建。
如果主机尚未完成构建,运行 crosstap 会显示相关说明::
$ crosstap root@192.168.1.88 trace_open.stp

Error: No target kernel build found.
Did you forget to create a local build of your image?
crosstap 需要目标系统的本地 SDK 构建,或包含 tools-profile 的构建, 才能生成用于探测目标系统的内核模块。
具体需要:
如果运行预构建镜像,下载用于构建该镜像的发行版和 BSP 压缩包。
如果使用 Git 源码,克隆构建该镜像所需的元数据和 BSP 层。
确保已正确配置镜像构建环境,参见 BSP README 或常见的镜像构建基础文档。
构建镜像的
-sdk版本,例如::$ bitbake core-image-sato-sdk
或构建非 SDK 镜像,但加入性能分析工具, 即向 EXTRA_IMAGE_FEATURES 添加
tools-profile::$ bitbake core-image-sato
主机构建完成后,即可启动该镜像或等效预构建镜像,使用
crosstap探测。 同样需要先加载环境::$ source oe-init-build-env $ cd ~/my/systemtap/scripts $ crosstap root@192.168.1.xxx myscript.stp
备注
使用 crosstap 的 SystemTap 假定你能够通过 SSH 连接远程目标。
SSH 连接验证详见 crosstap Wiki 页面。
*-minimal 镜像默认不启用 SSH 登录能力。
因此,需要按 基本配置
构建 SDK 镜像或包含 tools-profile 的镜像,再启动生成的目标镜像。
备注
如果 Build Directory 包含多种机器的构建,
必须选择正在连接的 MACHINE。
该机器构建目录中的内核必须与已启动系统的内核完全一致,
否则调用脚本时会出现上面的 crosstap 消息。
3 在目标上运行脚本
完成后,即可在目标运行 SystemTap 脚本::
$ cd /path/to/yocto
$ source oe-init-build-env

### Shell environment set up for builds. ###

You can now run 'bitbake <target>'

Common targets are:
         core-image-minimal
         core-image-sato
         meta-toolchain
         meta-ide-support

You can also run generated QEMU images with a command like 'runqemu qemux86-64'
然后 cd 到脚本所在目录,用 crosstap 执行::
$ cd /path/to/my/systemap/script
$ crosstap root@192.168.7.2 trace_open.stp
如果出现连接错误,例如::
$ crosstap root@192.168.7.2 trace_open.stp
error establishing ssh connection on remote 'root@192.168.7.2'
尝试直接通过 SSH 连接目标,观察结果::
$ ssh root@192.168.7.2
连接问题通常源于 IP 地址错误或 host key verification error。
正常情况下,应看到类似以下输出;提示时输入密码,如配置为空密码则直接回车:
$ crosstap root@192.168.7.2 trace_open.stp
root@192.168.7.2's password:
matchbox-termin(1036) open ("/tmp/vte3FS2LW", O_RDWR|O_CREAT|O_EXCL|O_LARGEFILE, 0600)
matchbox-termin(1036) open ("/tmp/vteJMC7LW", O_RDWR|O_CREAT|O_EXCL|O_LARGEFILE, 0600)
3 SystemTap 文档
语言参考见 SystemTap 语言参考。
其他文档、教程和示例见 SystemTap 文档页面。
3.4 Sysprof
Sysprof 是易用的全系统性能分析器。 单个窗口包含三个面板和几个按钮,可以在同一界面启动、停止并查看分析结果。
3 配置 Sysprof
本节假设已经完成 基本配置 所述的基本配置。
Sysprof 是在目标系统运行的图形应用。
下文假设通过 SSH 连接并在目标运行;如需远程显示,
可以使用 ssh -X,让程序在目标运行、界面显示在主机。
3 Sysprof 基本用法
按 Start 开始分析系统,按 Profile 停止并查看数据。
按下 Profile 后,三个面板会填充分析数据:
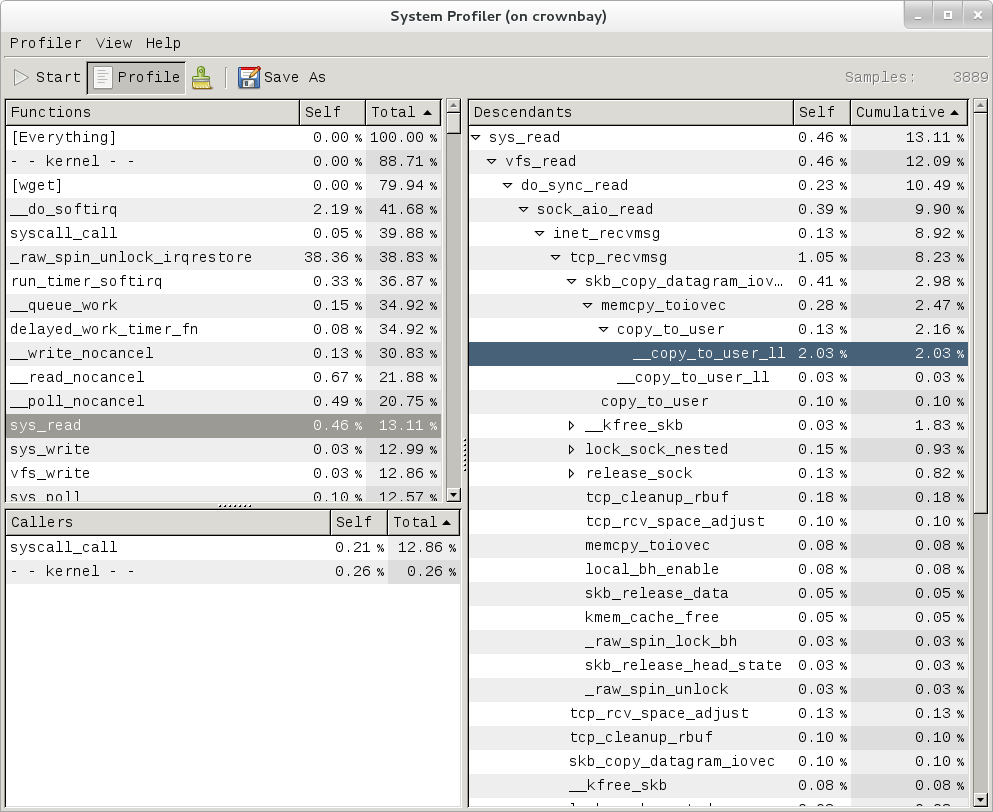
左侧列出函数和进程。选择一个条目,右侧会展开该函数,显示所有被调用者。 这种以调用者为中心的视图,与 perf 默认以被调用者为中心的调用链视图基本相反。
上图聚焦于 __copy_to_user_ll()。
沿调用链向上可以看到调用者之一 sys_read(),以及二者之间的完整路径。
这实际上是前面 perf 视图中相同信息的一部分。
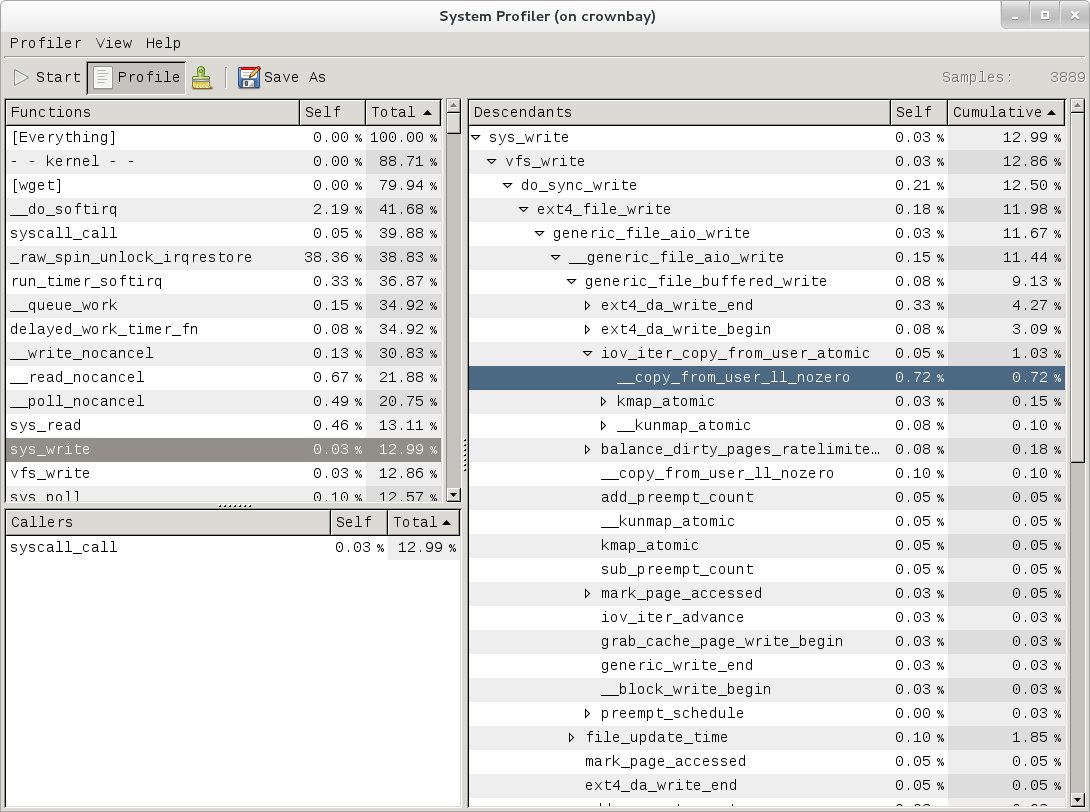
上图类似,展示 copy-from-user 的调用链。
左下方第三个面板列出左上方所选函数的全部调用者。
本例显示的是 __mark_inode_dirty 的调用者:
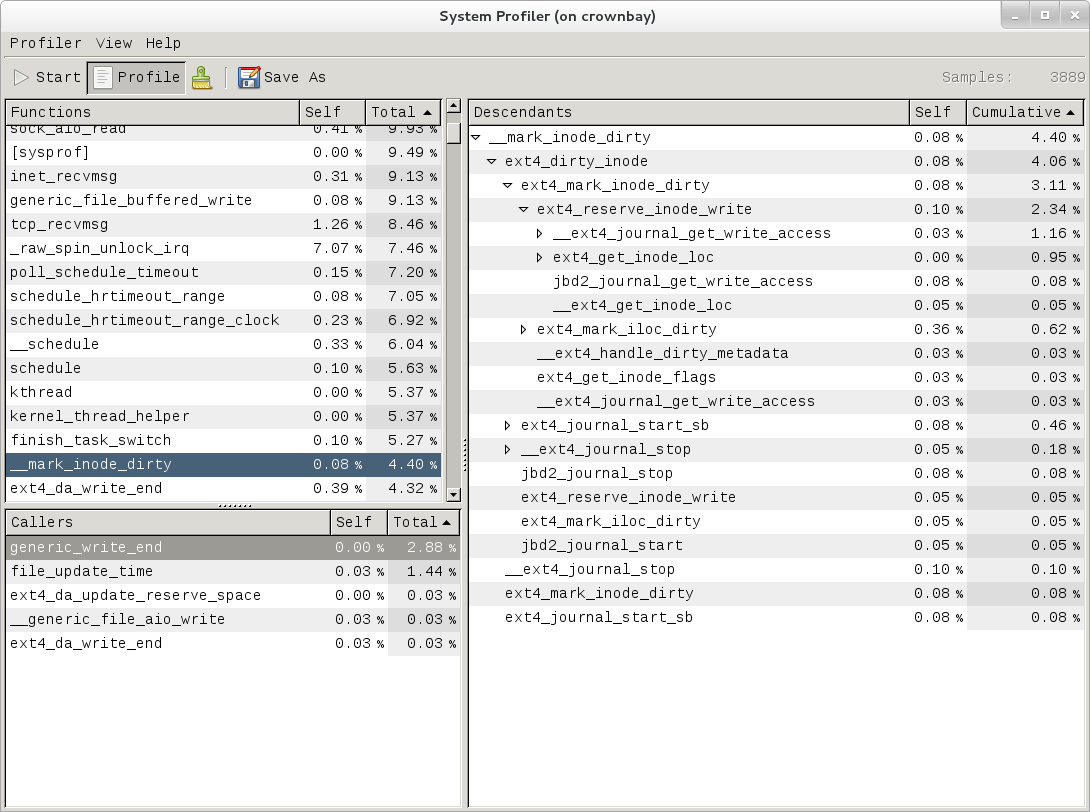
双击其中某个函数,可以将焦点转移到该函数,继续查看。
工具之间的联系
如果喜欢 Sysprof 的调用者视图,其他工具也可能实现类似效果。
例如,perf report 的 -g (--call-graph)选项包含 caller,
用于显示反向的、基于调用者的调用图。
3 Sysprof 文档
Sysprof 似乎没有专门文档,可能因为界面相当直观。 其网站为 Sysprof:Linux 全系统性能分析器。
3 LTTng(下一代 Linux Trace Toolkit)
3 配置 LTTng
本节假设已经完成 基本配置 所述的基本配置。 通过 SSH 连接目标系统,在目标上运行 LTTng。
3 收集和查看跟踪
应用上述提交,构建并启动镜像后,即可开始跟踪。
需要构建 core-image-sato-sdk,或使用
基本配置 所述的其他方法。
3 在目标 shell 中收集和查看跟踪
首先从主机通过 SSH 连接目标::
$ ssh -l root 192.168.1.47
The authenticity of host '192.168.1.47 (192.168.1.47)' can't be established.
RSA key fingerprint is 23:bd:c8:b1:a8:71:52:00:ee:00:4f:64:9e:10:b9:7e.
Are you sure you want to continue connecting (yes/no)? yes
Warning: Permanently added '192.168.1.47' (RSA) to the list of known hosts.
root@192.168.1.47's password:
在目标上创建跟踪::
root@crownbay:~# lttng create
Spawning a session daemon
Session auto-20121015-232120 created.
Traces will be written in /home/root/lttng-traces/auto-20121015-232120
启用所需事件,本例为全部内核事件::
root@crownbay:~# lttng enable-event --kernel --all
All kernel events are enabled in channel channel0
启动跟踪::
root@crownbay:~# lttng start
Tracing started for session auto-20121015-232120
等待一段时间,或运行完需要跟踪的负载后,停止跟踪::
root@crownbay:~# lttng stop
Tracing stopped for session auto-20121015-232120
现在可以在目标上以文本形式查看跟踪::
root@crownbay:~# lttng view
[23:21:56.989270399] (+?.?????????) sys_geteuid: { 1 }, { }
[23:21:56.989278081] (+0.000007682) exit_syscall: { 1 }, { ret = 0 }
[23:21:56.989286043] (+0.000007962) sys_pipe: { 1 }, { fildes = 0xB77B9E8C }
[23:21:56.989321802] (+0.000035759) exit_syscall: { 1 }, { ret = 0 }
[23:21:56.989329345] (+0.000007543) sys_mmap_pgoff: { 1 }, { addr = 0x0, len = 10485760, prot = 3, flags = 131362, fd = 4294967295, pgoff = 0 }
[23:21:56.989351694] (+0.000022349) exit_syscall: { 1 }, { ret = -1247805440 }
[23:21:56.989432989] (+0.000081295) sys_clone: { 1 }, { clone_flags = 0x411, newsp = 0xB5EFFFE4, parent_tid = 0xFFFFFFFF, child_tid = 0x0 }
[23:21:56.989477129] (+0.000044140) sched_stat_runtime: { 1 }, { comm = "lttng-consumerd", tid = 1193, runtime = 681660, vruntime = 43367983388 }
[23:21:56.989486697] (+0.000009568) sched_migrate_task: { 1 }, { comm = "lttng-consumerd", tid = 1193, prio = 20, orig_cpu = 1, dest_cpu = 1 }
[23:21:56.989508418] (+0.000021721) hrtimer_init: { 1 }, { hrtimer = 3970832076, clockid = 1, mode = 1 }
[23:21:56.989770462] (+0.000262044) hrtimer_cancel: { 1 }, { hrtimer = 3993865440 }
[23:21:56.989771580] (+0.000001118) hrtimer_cancel: { 0 }, { hrtimer = 3993812192 }
[23:21:56.989776957] (+0.000005377) hrtimer_expire_entry: { 1 }, { hrtimer = 3993865440, now = 79815980007057, function = 3238465232 }
[23:21:56.989778145] (+0.000001188) hrtimer_expire_entry: { 0 }, { hrtimer = 3993812192, now = 79815980008174, function = 3238465232 }
[23:21:56.989791695] (+0.000013550) softirq_raise: { 1 }, { vec = 1 }
[23:21:56.989795396] (+0.000003701) softirq_raise: { 0 }, { vec = 1 }
[23:21:56.989800635] (+0.000005239) softirq_raise: { 0 }, { vec = 9 }
[23:21:56.989807130] (+0.000006495) sched_stat_runtime: { 1 }, { comm = "lttng-consumerd", tid = 1193, runtime = 330710, vruntime = 43368314098 }
[23:21:56.989809993] (+0.000002863) sched_stat_runtime: { 0 }, { comm = "lttng-sessiond", tid = 1181, runtime = 1015313, vruntime = 36976733240 }
[23:21:56.989818514] (+0.000008521) hrtimer_expire_exit: { 0 }, { hrtimer = 3993812192 }
[23:21:56.989819631] (+0.000001117) hrtimer_expire_exit: { 1 }, { hrtimer = 3993865440 }
[23:21:56.989821866] (+0.000002235) hrtimer_start: { 0 }, { hrtimer = 3993812192, function = 3238465232, expires = 79815981000000, softexpires = 79815981000000 }
[23:21:56.989822984] (+0.000001118) hrtimer_start: { 1 }, { hrtimer = 3993865440, function = 3238465232, expires = 79815981000000, softexpires = 79815981000000 }
[23:21:56.989832762] (+0.000009778) softirq_entry: { 1 }, { vec = 1 }
[23:21:56.989833879] (+0.000001117) softirq_entry: { 0 }, { vec = 1 }
[23:21:56.989838069] (+0.000004190) timer_cancel: { 1 }, { timer = 3993871956 }
[23:21:56.989839187] (+0.000001118) timer_cancel: { 0 }, { timer = 3993818708 }
[23:21:56.989841492] (+0.000002305) timer_expire_entry: { 1 }, { timer = 3993871956, now = 79515980, function = 3238277552 }
[23:21:56.989842819] (+0.000001327) timer_expire_entry: { 0 }, { timer = 3993818708, now = 79515980, function = 3238277552 }
[23:21:56.989854831] (+0.000012012) sched_stat_runtime: { 1 }, { comm = "lttng-consumerd", tid = 1193, runtime = 49237, vruntime = 43368363335 }
[23:21:56.989855949] (+0.000001118) sched_stat_runtime: { 0 }, { comm = "lttng-sessiond", tid = 1181, runtime = 45121, vruntime = 36976778361 }
[23:21:56.989861257] (+0.000005308) sched_stat_sleep: { 1 }, { comm = "kworker/1:1", tid = 21, delay = 9451318 }
[23:21:56.989862374] (+0.000001117) sched_stat_sleep: { 0 }, { comm = "kworker/0:0", tid = 4, delay = 9958820 }
[23:21:56.989868241] (+0.000005867) sched_wakeup: { 0 }, { comm = "kworker/0:0", tid = 4, prio = 120, success = 1, target_cpu = 0 }
[23:21:56.989869358] (+0.000001117) sched_wakeup: { 1 }, { comm = "kworker/1:1", tid = 21, prio = 120, success = 1, target_cpu = 1 }
[23:21:56.989877460] (+0.000008102) timer_expire_exit: { 1 }, { timer = 3993871956 }
[23:21:56.989878577] (+0.000001117) timer_expire_exit: { 0 }, { timer = 3993818708 }
.
.
.
之后可以安全销毁会话。此操作不会删除跟踪数据,它仍保存在 ~/lttng-traces::
root@crownbay:~# lttng destroy
Session auto-20121015-232120 destroyed at /home/root
数据目录位于 ~/lttng-traces 下,名称与 lttng create 返回的名称相同。
也可以向 lttng create 提供自定义名称::
root@crownbay:~# ls -al ~/lttng-traces
drwxrwx---    3 root     root          1024 Oct 15 23:21 .
drwxr-xr-x    5 root     root          1024 Oct 15 23:57 ..
drwxrwx---    3 root     root          1024 Oct 15 23:21 auto-20121015-232120
3 在目标 shell 中收集和查看用户空间跟踪
LTTng 用户空间跟踪需要正确插桩的用户程序。
本例使用 lttng-ust 构建生成的 hello 测试程序。
构建不会将它安装到根文件系统,因此需要手动复制。
先进入包含 hello 可执行文件的构建目录::
$ cd build/tmp/work/core2_32-poky-linux/lttng-ust/2.0.5-r0/git/tests/hello/.libs
复制到目标机器::
$ scp hello root@192.168.1.20:
现在目标上已有经过插桩的 LTTng "hello world" 测试程序。
从主机通过 SSH 连接目标::
$ ssh -l root 192.168.1.47
The authenticity of host '192.168.1.47 (192.168.1.47)' can't be established.
RSA key fingerprint is 23:bd:c8:b1:a8:71:52:00:ee:00:4f:64:9e:10:b9:7e.
Are you sure you want to continue connecting (yes/no)? yes
Warning: Permanently added '192.168.1.47' (RSA) to the list of known hosts.
root@192.168.1.47's password:
在目标上创建跟踪::
root@crownbay:~# lttng create
Session auto-20190303-021943 created.
Traces will be written in /home/root/lttng-traces/auto-20190303-021943
启用所需事件,本例为全部用户空间事件::
root@crownbay:~# lttng enable-event --userspace --all
All UST events are enabled in channel channel0
启动跟踪::
root@crownbay:~# lttng start
Tracing started for session auto-20190303-021943
运行插桩后的 "hello world"::
root@crownbay:~# ./hello
Hello, World!
Tracing... done.
等待一段时间,或运行完需要跟踪的负载后,停止跟踪::
root@crownbay:~# lttng stop
Tracing stopped for session auto-20190303-021943
在目标上以文本形式查看跟踪::
root@crownbay:~# lttng view
[02:31:14.906146544] (+?.?????????) hello:1424 ust_tests_hello:tptest: { cpu_id = 1 }, { intfield = 0, intfield2 = 0x0, longfield = 0, netintfield = 0, netintfieldhex = 0x0, arrfield1 = [ [0] = 1, [1] = 2, [2] = 3 ], arrfield2 = "test", _seqfield1_length = 4, seqfield1 = [ [0] = 116, [1] = 101, [2] = 115, [3] = 116 ], _seqfield2_length = 4,  seqfield2 = "test", stringfield = "test", floatfield = 2222, doublefield = 2, boolfield = 1 }
[02:31:14.906170360] (+0.000023816) hello:1424 ust_tests_hello:tptest: { cpu_id = 1 }, { intfield = 1, intfield2 = 0x1, longfield = 1, netintfield = 1, netintfieldhex = 0x1, arrfield1 = [ [0] = 1, [1] = 2, [2] = 3 ], arrfield2 = "test", _seqfield1_length = 4, seqfield1 = [ [0] = 116, [1] = 101, [2] = 115, [3] = 116 ], _seqfield2_length = 4, seqfield2 = "test", stringfield = "test", floatfield = 2222, doublefield = 2, boolfield = 1 }
[02:31:14.906183140] (+0.000012780) hello:1424 ust_tests_hello:tptest: { cpu_id = 1 }, { intfield = 2, intfield2 = 0x2, longfield = 2, netintfield = 2, netintfieldhex = 0x2, arrfield1 = [ [0] = 1, [1] = 2, [2] = 3 ], arrfield2 = "test", _seqfield1_length = 4, seqfield1 = [ [0] = 116, [1] = 101, [2] = 115, [3] = 116 ], _seqfield2_length = 4, seqfield2 = "test", stringfield = "test", floatfield = 2222, doublefield = 2, boolfield = 1 }
[02:31:14.906194385] (+0.000011245) hello:1424 ust_tests_hello:tptest: { cpu_id = 1 }, { intfield = 3, intfield2 = 0x3, longfield = 3, netintfield = 3, netintfieldhex = 0x3, arrfield1 = [ [0] = 1, [1] = 2, [2] = 3 ], arrfield2 = "test", _seqfield1_length = 4, seqfield1 = [ [0] = 116, [1] = 101, [2] = 115, [3] = 116 ], _seqfield2_length = 4, seqfield2 = "test", stringfield = "test", floatfield = 2222, doublefield = 2, boolfield = 1 }
.
.
.
现在可以安全销毁会话,跟踪数据仍保留在 ~/lttng-traces::
root@crownbay:~# lttng destroy
Session auto-20190303-021943 destroyed at /home/root
3 LTTng 文档
主要文档位于 LTTng 文档网站, 适合在 Linux 环境工作、希望高效进行软件跟踪的中高级开发者。
一般项目介绍见 LTTng 项目网站, 其中 "Getting Started" 链接通向快速入门指南。
3.6 blktrace
blktrace 用于跟踪并报告底层磁盘 I/O。 它负责收集跟踪数据,输出可以通过管道交给 blkparse, 后者将数据转换为可读形式,并进行基本分析。
3 配置 blktrace
本节假设已经完成 基本配置 所述的基本配置。
blktrace 在目标系统上运行。 可以在目标上运行完整的 blktrace 和 blkparse 管道, 也可以使用远程模式,由主机收集和分析数据,详见后面的 远程使用 blktrace。 本节其余部分假设通过 SSH 连接,并在目标上运行 blktrace。
3 blktrace 基本用法
运行 blktrace 并指定待跟踪块设备,即可开始记录::
root@crownbay:~# blktrace /dev/sdc
在另一个 shell 中执行负载::
root@crownbay:/media/sdc# rm linux-2.6.19.2.tar.bz2; wget https://downloads.yoctoproject.org/mirror/sources/linux-2.6.19.2.tar.bz2; sync
Connecting to downloads.yoctoproject.org (140.211.169.59:80)
linux-2.6.19.2.tar.b 100% \|*******************************\| 41727k 0:00:00 ETA
在 blktrace 的 shell 中按 Ctrl-C 停止。
它会显示记录的事件数及每个 CPU 对应的文件大小。
blktrace 在每 CPU 内核缓冲区中记录,再转储到用户空间,供 blkparse 合并和排序::
^C=== sdc ===
 CPU  0:                 7082 events,      332 KiB data
 CPU  1:                 1578 events,       74 KiB data
 Total:                  8660 events (dropped 0),      406 KiB data
查看保存到磁盘的文件,会发现每个 CPU 对应一个文件,文件名以设备名开头::
root@crownbay:~# ls -al
drwxr-xr-x    6 root     root          1024 Oct 27 22:39 .
drwxr-sr-x    4 root     root          1024 Oct 26 18:24 ..
-rw-r--r--    1 root     root        339938 Oct 27 22:40 sdc.blktrace.0
-rw-r--r--    1 root     root         75753 Oct 27 22:40 sdc.blktrace.1
在跟踪文件所在目录运行 blkparse,传入文件名前缀对应的设备名::
root@crownbay:~# blkparse sdc

 8,32   1        1     0.000000000  1225  Q  WS 3417048 + 8 [jbd2/sdc-8]
 8,32   1        2     0.000025213  1225  G  WS 3417048 + 8 [jbd2/sdc-8]
 8,32   1        3     0.000033384  1225  P   N [jbd2/sdc-8]
 8,32   1        4     0.000043301  1225  I  WS 3417048 + 8 [jbd2/sdc-8]
 8,32   1        0     0.000057270     0  m   N cfq1225 insert_request
 8,32   1        0     0.000064813     0  m   N cfq1225 add_to_rr
 8,32   1        5     0.000076336  1225  U   N [jbd2/sdc-8] 1
 8,32   1        0     0.000088559     0  m   N cfq workload slice:150
 8,32   1        0     0.000097359     0  m   N cfq1225 set_active wl_prio:0 wl_type:1
 8,32   1        0     0.000104063     0  m   N cfq1225 Not idling. st->count:1
 8,32   1        0     0.000112584     0  m   N cfq1225 fifo=  (null)
 8,32   1        0     0.000118730     0  m   N cfq1225 dispatch_insert
 8,32   1        0     0.000127390     0  m   N cfq1225 dispatched a request
 8,32   1        0     0.000133536     0  m   N cfq1225 activate rq, drv=1
 8,32   1        6     0.000136889  1225  D  WS 3417048 + 8 [jbd2/sdc-8]
 8,32   1        7     0.000360381  1225  Q  WS 3417056 + 8 [jbd2/sdc-8]
 8,32   1        8     0.000377422  1225  G  WS 3417056 + 8 [jbd2/sdc-8]
 8,32   1        9     0.000388876  1225  P   N [jbd2/sdc-8]
 8,32   1       10     0.000397886  1225  Q  WS 3417064 + 8 [jbd2/sdc-8]
 8,32   1       11     0.000404800  1225  M  WS 3417064 + 8 [jbd2/sdc-8]
 8,32   1       12     0.000412343  1225  Q  WS 3417072 + 8 [jbd2/sdc-8]
 8,32   1       13     0.000416533  1225  M  WS 3417072 + 8 [jbd2/sdc-8]
 8,32   1       14     0.000422121  1225  Q  WS 3417080 + 8 [jbd2/sdc-8]
 8,32   1       15     0.000425194  1225  M  WS 3417080 + 8 [jbd2/sdc-8]
 8,32   1       16     0.000431968  1225  Q  WS 3417088 + 8 [jbd2/sdc-8]
 8,32   1       17     0.000435251  1225  M  WS 3417088 + 8 [jbd2/sdc-8]
 8,32   1       18     0.000440279  1225  Q  WS 3417096 + 8 [jbd2/sdc-8]
 8,32   1       19     0.000443911  1225  M  WS 3417096 + 8 [jbd2/sdc-8]
 8,32   1       20     0.000450336  1225  Q  WS 3417104 + 8 [jbd2/sdc-8]
 8,32   1       21     0.000454038  1225  M  WS 3417104 + 8 [jbd2/sdc-8]
 8,32   1       22     0.000462070  1225  Q  WS 3417112 + 8 [jbd2/sdc-8]
 8,32   1       23     0.000465422  1225  M  WS 3417112 + 8 [jbd2/sdc-8]
 8,32   1       24     0.000474222  1225  I  WS 3417056 + 64 [jbd2/sdc-8]
 8,32   1        0     0.000483022     0  m   N cfq1225 insert_request
 8,32   1       25     0.000489727  1225  U   N [jbd2/sdc-8] 1
 8,32   1        0     0.000498457     0  m   N cfq1225 Not idling. st->count:1
 8,32   1        0     0.000503765     0  m   N cfq1225 dispatch_insert
 8,32   1        0     0.000512914     0  m   N cfq1225 dispatched a request
 8,32   1        0     0.000518851     0  m   N cfq1225 activate rq, drv=2
 .
 .
 .
 8,32   0        0    58.515006138     0  m   N cfq3551 complete rqnoidle 1
 8,32   0     2024    58.516603269     3  C  WS 3156992 + 16 [0]
 8,32   0        0    58.516626736     0  m   N cfq3551 complete rqnoidle 1
 8,32   0        0    58.516634558     0  m   N cfq3551 arm_idle: 8 group_idle: 0
 8,32   0        0    58.516636933     0  m   N cfq schedule dispatch
 8,32   1        0    58.516971613     0  m   N cfq3551 slice expired t=0
 8,32   1        0    58.516982089     0  m   N cfq3551 sl_used=13 disp=6 charge=13 iops=0 sect=80
 8,32   1        0    58.516985511     0  m   N cfq3551 del_from_rr
 8,32   1        0    58.516990819     0  m   N cfq3551 put_queue

CPU0 (sdc):
 Reads Queued:           0,        0KiB       Writes Queued:         331,   26,284KiB
 Read Dispatches:        0,        0KiB       Write Dispatches:      485,   40,484KiB
 Reads Requeued:         0                    Writes Requeued:         0
 Reads Completed:        0,        0KiB       Writes Completed:      511,   41,000KiB
 Read Merges:            0,        0KiB       Write Merges:           13,      160KiB
 Read depth:             0                    Write depth:             2
 IO unplugs:            23                    Timer unplugs:           0
CPU1 (sdc):
 Reads Queued:           0,        0KiB       Writes Queued:         249,   15,800KiB
 Read Dispatches:        0,        0KiB       Write Dispatches:       42,    1,600KiB
 Reads Requeued:         0                    Writes Requeued:         0
 Reads Completed:        0,        0KiB       Writes Completed:       16,    1,084KiB
 Read Merges:            0,        0KiB       Write Merges:           40,      276KiB
 Read depth:             0                    Write depth:             2
 IO unplugs:            30                    Timer unplugs:           1

Total (sdc):
 Reads Queued:           0,        0KiB       Writes Queued:         580,   42,084KiB
 Read Dispatches:        0,        0KiB       Write Dispatches:      527,   42,084KiB
 Reads Requeued:         0                    Writes Requeued:         0
 Reads Completed:        0,        0KiB       Writes Completed:      527,   42,084KiB
 Read Merges:            0,        0KiB       Write Merges:           53,      436KiB
 IO unplugs:            53                    Timer unplugs:           1

Throughput (R/W): 0KiB/s / 719KiB/s
Events (sdc): 6,592 entries
Skips: 0 forward (0 -   0.0%)
Input file sdc.blktrace.0 added
Input file sdc.blktrace.1 added
报告列出数据中的每个事件,并汇总运行期间的块 I/O 活动。 各字段含义见 blkparse(1)。
3 实时模式
blktrace 和 blkparse 从设计上就支持管道模式, 可以将前者的标准输出直接传给后者的标准输入::
root@crownbay:~# blktrace /dev/sdc -o - | blkparse -i -
这样可以长时间运行跟踪,而不向磁盘写入数据。 用户可以查看屏幕上滚动的输出,实时寻找特定情况, 也可以继续通过管道传给 grep 等工具,识别并捕获感兴趣的事件。
另外还有一个命令将上述管道封装为单条命令,无需手动输入整个序列::
root@crownbay:~# btrace /dev/sdc
3 远程使用 blktrace
blktrace 跟踪块 I/O,但通常也把数据写入块设备。 让跟踪器写入正在被跟踪的设备会干扰观察,因此它原生支持通过网络发送全部数据, 避免影响待测设备。
在用于保存数据的主机上,以服务器模式启动 blktrace::
$ blktrace -l
server: waiting for connections...
在待跟踪的目标上,以客户端模式启动,使用 -h 连接主机,并指定待跟踪设备::
root@crownbay:~# blktrace -d /dev/sdc -h 192.168.1.43
blktrace: connecting to 192.168.1.43
blktrace: connected!
主机上应看到::
server: connection from 192.168.1.43
在另一个 shell 中执行负载::
root@crownbay:/media/sdc# rm linux-2.6.19.2.tar.bz2; wget https://downloads.yoctoproject.org/mirror/sources/linux-2.6.19.2.tar.bz2; sync
Connecting to downloads.yoctoproject.org (140.211.169.59:80)
linux-2.6.19.2.tar.b 100% \|*******************************\| 41727k 0:00:00 ETA
完成后,在目标上按 Ctrl-C 停止跟踪::
^C=== sdc ===
 CPU  0:                 7691 events,      361 KiB data
 CPU  1:                 4109 events,      193 KiB data
 Total:                 11800 events (dropped 0),      554 KiB data
主机上也会显示刚结束的跟踪摘要::
server: end of run for 192.168.1.43:sdc
=== sdc ===
 CPU  0:                 7691 events,      361 KiB data
 CPU  1:                 4109 events,      193 KiB data
 Total:                 11800 events (dropped 0),      554 KiB data
主机上的 blktrace 将目标输出保存到 <hostname>-<timestamp> 目录::
$ ls -al
drwxr-xr-x   10 root     root          1024 Oct 28 02:40 .
drwxr-sr-x    4 root     root          1024 Oct 26 18:24 ..
drwxr-xr-x    2 root     root          1024 Oct 28 02:40 192.168.1.43-2012-10-28-02:40:56
进入该目录查看输出文件::
$ ls -l
-rw-r--r--    1 root     root        369193 Oct 28 02:44 sdc.blktrace.0
-rw-r--r--    1 root     root        197278 Oct 28 02:44 sdc.blktrace.1
在主机上运行 blkparse,指定设备名::
$ blkparse sdc

 8,32   1        1     0.000000000  1263  Q  RM 6016 + 8 [ls]
 8,32   1        0     0.000036038     0  m   N cfq1263 alloced
 8,32   1        2     0.000039390  1263  G  RM 6016 + 8 [ls]
 8,32   1        3     0.000049168  1263  I  RM 6016 + 8 [ls]
 8,32   1        0     0.000056152     0  m   N cfq1263 insert_request
 8,32   1        0     0.000061600     0  m   N cfq1263 add_to_rr
 8,32   1        0     0.000075498     0  m   N cfq workload slice:300
 .
 .
 .
 8,32   0        0   177.266385696     0  m   N cfq1267 arm_idle: 8 group_idle: 0
 8,32   0        0   177.266388140     0  m   N cfq schedule dispatch
 8,32   1        0   177.266679239     0  m   N cfq1267 slice expired t=0
 8,32   1        0   177.266689297     0  m   N cfq1267 sl_used=9 disp=6 charge=9 iops=0 sect=56
 8,32   1        0   177.266692649     0  m   N cfq1267 del_from_rr
 8,32   1        0   177.266696560     0  m   N cfq1267 put_queue

CPU0 (sdc):
 Reads Queued:           0,        0KiB       Writes Queued:         270,   21,708KiB
 Read Dispatches:       59,    2,628KiB       Write Dispatches:      495,   39,964KiB
 Reads Requeued:         0                    Writes Requeued:         0
 Reads Completed:       90,    2,752KiB       Writes Completed:      543,   41,596KiB
 Read Merges:            0,        0KiB       Write Merges:            9,      344KiB
 Read depth:             2                    Write depth:             2
 IO unplugs:            20                    Timer unplugs:           1
CPU1 (sdc):
 Reads Queued:         688,    2,752KiB       Writes Queued:         381,   20,652KiB
 Read Dispatches:       31,      124KiB       Write Dispatches:       59,    2,396KiB
 Reads Requeued:         0                    Writes Requeued:         0
 Reads Completed:        0,        0KiB       Writes Completed:       11,      764KiB
 Read Merges:          598,    2,392KiB       Write Merges:           88,      448KiB
 Read depth:             2                    Write depth:             2
 IO unplugs:            52                    Timer unplugs:           0

Total (sdc):
 Reads Queued:         688,    2,752KiB       Writes Queued:         651,   42,360KiB
 Read Dispatches:       90,    2,752KiB       Write Dispatches:      554,   42,360KiB
 Reads Requeued:         0                    Writes Requeued:         0
 Reads Completed:       90,    2,752KiB       Writes Completed:      554,   42,360KiB
 Read Merges:          598,    2,392KiB       Write Merges:           97,      792KiB
 IO unplugs:            72                    Timer unplugs:           1

Throughput (R/W): 15KiB/s / 238KiB/s
Events (sdc): 9,301 entries
Skips: 0 forward (0 -   0.0%)
得到的事件和摘要,应与在目标上运行相同命令时一致。
3 通过 ftrace 跟踪块 I/O
也可以仅使用 trace event 子系统 跟踪块 I/O。如果只是临时查看,不想处理用户空间工具,这种方式很方便。
通过 /sys/block/xxx/trace/enable 启用指定设备的跟踪,xxx 为设备名。
例如,启用 /dev/sdc::
root@crownbay:/sys/kernel/debug/tracing# echo 1 > /sys/block/sdc/trace/enable
选择设备后,再选择 blk 跟踪器将其启用::
root@crownbay:/sys/kernel/debug/tracing# cat available_tracers
blk function_graph function nop

root@crownbay:/sys/kernel/debug/tracing# echo blk > current_tracer
执行感兴趣的负载::
root@crownbay:/sys/kernel/debug/tracing# cat /media/sdc/testfile.txt
查看输出。这里使用 trace_pipe 而非 trace,
以便在管道中等待数据出现::
root@crownbay:/sys/kernel/debug/tracing# cat trace_pipe
            cat-3587  [001] d..1  3023.276361:   8,32   Q   R 1699848 + 8 [cat]
            cat-3587  [001] d..1  3023.276410:   8,32   m   N cfq3587 alloced
            cat-3587  [001] d..1  3023.276415:   8,32   G   R 1699848 + 8 [cat]
            cat-3587  [001] d..1  3023.276424:   8,32   P   N [cat]
            cat-3587  [001] d..2  3023.276432:   8,32   I   R 1699848 + 8 [cat]
            cat-3587  [001] d..1  3023.276439:   8,32   m   N cfq3587 insert_request
            cat-3587  [001] d..1  3023.276445:   8,32   m   N cfq3587 add_to_rr
            cat-3587  [001] d..2  3023.276454:   8,32   U   N [cat] 1
            cat-3587  [001] d..1  3023.276464:   8,32   m   N cfq workload slice:150
            cat-3587  [001] d..1  3023.276471:   8,32   m   N cfq3587 set_active wl_prio:0 wl_type:2
            cat-3587  [001] d..1  3023.276478:   8,32   m   N cfq3587 fifo=  (null)
            cat-3587  [001] d..1  3023.276483:   8,32   m   N cfq3587 dispatch_insert
            cat-3587  [001] d..1  3023.276490:   8,32   m   N cfq3587 dispatched a request
            cat-3587  [001] d..1  3023.276497:   8,32   m   N cfq3587 activate rq, drv=1
            cat-3587  [001] d..2  3023.276500:   8,32   D   R 1699848 + 8 [cat]
关闭指定设备的跟踪::
root@crownbay:/sys/kernel/debug/tracing# echo 0 > /sys/block/sdc/trace/enable
3 blktrace 文档
本节命令的在线手册如下:
这些手册及其他 blktrace 工具(btt、blkiomon 等)的手册,
位于 blktrace 工具 Git 仓库的 /doc 目录::
$ git clone https://git.kernel.org/pub/scm/linux/kernel/git/axboe/blktrace.git